 |

|
| LastUpdate 11/29/2024 |
| �@"Grapes" and "Function View" are famous as excellent free software that draws very easily just by substituting formulas of functions. �@In high school mathematics classes , when teaching graphs of quadratic functions , students create an xy correspondence table , plot the points on the xy-coordinate plane , and draw a graph by connecting the points with a smooth curve. �@"Grapes" and "Function View"draw graphs simply by substituting function expressions.�@Therefore , there is little sense of creating an xy correspondence table , plotting the points , and connecting them with a smooth curve. �@However , Excel is the software that makes it possible on a computer to create an xy correspondence table , plot points , and draw a graph with a sense of connecting them with a smooth curve. Excel is a spreadsheet sofrware that we use on a daily basis. �@When I went to a public library in Higashi-Omi , I happened to come across a book titled "Easy Mathematics Learning with Excel (from Trigonometory to Calculus) , Co-authered by Yukihisa Takahashi and Ha Watanabe , Ohmusha Publishinng". I found a description that made me realize that how to draw a graph of a funcion using "Excel" and the way of thinking about numerical sequences is exactly the copy function of "Excel". �@In addition , I introduced what can be done using "Excel" in "Simulation" , "Prime and Perfect Numbers" , and "Polor Equations" in Table of Contents 12-14. Please try it. You should be able to apply it to the other things as well. �@By using "Grapes" , "Function View" , and "Excel" according to the senses , skills , and knowledge you want students to acqure , I believe that more effective lessons can be organized. |
| http://kn-makkun.com/MakkunWp/excels.html |
| No | Table of contents |
| �P | �@Quadatic function |
| �Q | �@Trigonometric function |
| �R | �@Exponential function |
| �S | �@Logarithmic function |
| �T | �@Varius curves |
| �U | �@Differentiation (Part 1) |
| �V | �@Differentiation (Part 2) |
| �W | �@Integral |
| �X | �@Number sequence |
| �P�O | �@Complex number |
| �P�P | �@Application of square root |
| �P�Q | �@Simulation �@ |
| �P�R | �@Prime snd perfect numbers�@ |
| �P�S | �@Polar equation�@ |
| �P�T | �@Download�@ |
| �P�U | �@How to use the sample data |
| Back to the Top Page |
| �@To table of contents�@ |
| �@�y�P�O�P�z Draw a graph of the quadratic functions of y=x^2 , y=2x^2 , and y=3x^2. | |||||||||||||||||||||||||||||||||||||||||||||||||||||||
| �@��Procedure�� �@�@�@(1) Create the following correspondence table on the worksheet.
�@�@�@��Reference�� �@�@�@�@�@�sHow to complete the worksheet above�t �@�@�@�@�@�@�@Enter -4 in half-width in cell B12. �@�@�@�@�@�@�@Enter =B12+1 in half-width in cell B13. �@�@�@�@�@�@�@Right-click cell B13 and select Copy. �@�@�@�@�@�@�@Drag the cell range B14:B20 , right-click , and select Paste. �@�@�@�@�@�@�@Enter =B12^2 in half-width in cell C12. �@�@�@�@�@�@�@Enter =2*B12^2 in half-width in cell D12. �@�@�@�@�@�@�@Enter =3*B12^2 in half-width in cell E12. �@�@�@�@�@�@�@Drag the cell range C12:E12 , right-click , and select Copy. �@�@�@�@�@�@�@Drag the cell range C13:C20 , right-click , and select Paste. �@�@�@(2) Draw a graph from the correspondence table in (1) above. �@�@�@�@�@�@�@ Drag and select the cell range B11:E20 in the correspondence table of (1) above. �@�@�@�@�@�@�A Left-click [Insert]��[Scatter plot]��[Smooth line and marker]. �@�@�@(3) Arrange the xy coordinate plane on which the graoh is drawn. �@�@�@�@�@�@�@ Right-click on the numbers on the x-axis �� Axis formating �� Scale interval Fixed 1.0 �@�@�@�@�@�@�� Close �� Right-click on the numbers on the x-axis �� Add grid lines �@�@�@�@�@�@�A Right-click on the numbers on the y-axis �� Axis formating �� Scale interval Fixed 5.0 �@�@�@�@�@�@�� Close �@�@�@(4) Delete points (markers) in the correspondence table from the graph. �@�@�@�@�@�@�@ Left-click on the graph area to activate it. �@�@�@�@�@�@�A Left-click [Insert]��[Scatter plot]��[Smooth line]. �@�@�@�@�@�@ 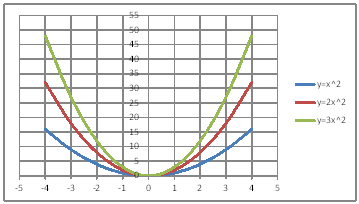 �@�@�@��Consideration 1�� �@�@�@�@�@�@Compare the spread of graphs of y=x^2 , y=2x^2 , and y=3x^2.�@ �@�@�@��Consideration 2�� �@�@�@�@�@�@In general , how does the spread of the graph of y=ax^2 change depending on the value of a ? |
| �@�y�P�O�Q�z Draw a graph of the quadratic functions of y=2x^2 and y=-2x^2. | ||||||||||||||||||||||||||||||||||||||||||||
| �@��Procedure�� �@�@�@(1) Create the following correspondence table on the worksheet. �@�@�@��Reference�� �@�@�@�@�@�@Please refer to �y�P�O�P�z how to enter the worksheet.
�@�@�@ (2) Draw a graph from the correspondence table in (1) above. �@�@�@�@�@�@�@ Drag and select the cell range B11:D20 in the correspondence table of (1) above. �@�@�@�@�@�@�A Left click �mInsert�n���mScatter plot�n���mSmooth line and Marker�n �@�@�@(3) Arrange the xy coordinate plane on which the graph is drawn. �@�@�@�@�@�@�@ Right-click on the numbers on the x-axis �� Axis formating �� Scale interval Fixed 1.0 �@�@�@�@�@�@�� Close �� Right-click on the numbers on the x-axis �� Add gridlines �@�@�@�@�@�@�A Right-click on the numbers on the y-axis �� Axis formating �� Scale interval Fixed 5.0 �@�@�@�@�@�@�� Close �@�@�@(4) Delete points (markers) in the correspondence table from the graph. �@�@�@�@�@�@�@ Left-click on the graph area to activate it . �@�@�@�@�@�@�A Left-click �mInsert�n���mScatter plot�n���mSmooth line�n �@�@�@�@�@�@ �@�@�@�@�@�@ 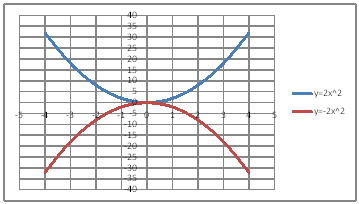 �@�@�@�@�@�@ �@�@�@��Consideration 1�� �@�@�@�@�@�@State the positional relationship between the graphs of y=2x^2 and y=-2x^2.�@ �@�@�@��Consideration 2�� �@�@�@�@�@�@In general , what is the positional relationship between the graphs of y=ax^2 and y=-ax^2 ? |
| �@�y�P�O�R�z Draw a graph of the quadratic functions of y=2x^�Q , y=2x^2+3 , and y=2x^2-3. | |||||||||||||||||||||||||||||||||||||||||||||||||||||||
| �@��Procedure�� �@�@�@(1) Create the following correspondence table on the worksheet. �@�@�@��Reference�� �@�@�@�@�@�@Please refer to �y�P�O�P�z how to complete the worksheet.
�@�@�@(2) Draw a graph from the correspondence table in (1) above. �@�@�@�@�@�@�@ Drag and select the cell range B11:E20 in the correspondence table of (1) above. �@�@�@�@�@�@�A Left-click �mInsert�n���mScatter plot�n���mSmooth line and Marker�n. �@�@�@(3) Arrange the xy coordinate plane on which the graph is drawn. �@�@�@�@�@�@�@ Right-click on the numbers on the x-axis �� Axis formating �� Scale interval Fixed 1.0 �@�@�@�@�@�@�� Close �� Right-click on the numbers on the x-axis �� Add gridlines �@�@�@�@�@�@�A Right-click on the numbers on the y-axis �� Axis formating �� Scale interval Fixed 5.0 �@�@�@�@�@�@�� Close �@�@�@(4) Delete points (markers) in the correspondence table from the graph. �@�@�@�@�@�@�@ Left-click on the graph-area to activate it. �@�@�@�@�@�@�A Left-click �mInsert�n���mScatter plot�n���mSmooth line] �@�@�@�@�@�@ 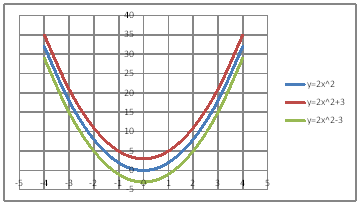 �@�@�@��Consideration 1�� �@�@�@�@�@�@�@Compare the spread of the graphs of y=2x^2 , y=2x^2+3 , and y=2x^2-3. �@�@�@��Consideration 2�� �@�@�@�@�@�@�@State the positional relationship of the graphs of y=2x^2 , y=2x^2+3 , and y=2x^2-3. �@�@�@��Consideration 3�� �@�@�@�@�@�@�@In general , what is the positional relationship between graphs of y=ax^2 and y=ax^2+b ? |
| �@�y�P�O�S�z Draw a graph of the quadratic functions of y=2x^2 , y=2(x+2)^2 , and y=2(x-2)^2. | |||||||||||||||||||||||||||||||||||||||||||||||||||||||
| �@��Procedure�� �@�@�@(1) Create the following correspondence table on the worksheet. �@�@�@��Reference�� �@�@�@�@�@�@Please refer to �y�P�O�P�z how to enter the worksheet.
�@�@�@(2) Draw a graph from the correspondence table in (1) above. �@�@�@�@�@�@�@ Drag and select the cell range B11:E20 in the correspondence table of (1) above. �@�@�@�@�@�@�A Left-click �mInsert�n���mScatter plot�n���mSmooth line and Marker�n �@�@�@(3) Arrange the xy coordinate plane on which the graph is drawn. �@�@�@�@�@�@�@ Right-click on the numbers on the x-axis �� Axis formating �� Scale interval Fixed 1.0 �@�@�@�@�@�@�� Close �� Right-click on the numbers on the x-axis �� Add gridlines �@�@�@�@�@�@�A Right-click on the numbers on the y-axis �� Axis formating �� Scale interval Fixed 5.0 �@�@�@�@�@�@�� Close �@�@�@(4) Deleate points (markers) in the correspondence table from the graph. �@�@�@�@�@�@�@ Left-click on the graph area to activate it. �@�@�@�@�@�@�A Left-click �mInsert�n���mScatter plot�n���mSmooth line�n �@�@�@�@�@�@ 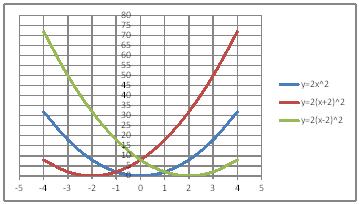 �@�@�@��Consideration 1�� �@�@�@�@�@�@�@Compare the spread of the graphs of y=2x^2 , y=2(x+2)^2 , and y=2(x-2)^2. �@�@�@��Consideration 2�� �@�@�@�@�@�@�@State the positional relationship of the graphs of y=2x^2 , y=2(x+2)^2 , and y=2(x-2)^2. �@�@�@��Consideration 3�� �@�@�@�@�@�@�@In general , what is the positional relationship between graphs of y=ax^2 and y=a(x-b)^2 ? |
| �@�y�P�O�T�z Draw a graph of the quadratic functions of y=2x^2 and y=2(x-2)^2+3. | ||||||||||||||||||||||||||||||||||||||||||||
| �@��Procedure�� �@�@�@(1) Create the folllowing correspondence table on the worksheet. �@�@�@��Reference�� �@�@�@�@�@�@Please refer to �y�P�O�P�z how to enter the worksheet.
�@�@�@(2) Draw a graph from the correspondence table in (1) above. �@�@�@�@�@�@�@ Drag and select the cell range B11:D20 in the correspondence table of (1) above. �@�@�@�@�@�@�A Left -click �mInsert�n���mScatter plot�n���mSmooth line and Marker]. �@�@�@(3) Arrange the xy coordinate plane on which the graph is drawn. �@�@�@�@�@�@�@ Right-click on the numbers on the x-axis �� Axis formating �� Scale interval Fixed 1.0 �@�@�@�@�@�@�� Close �� Right-click on the numbers on the x-axis �� Add gridlines �@�@�@�@�@�@�A Right-click on the numbers on the y-axis �� Axis formating �� Auxiliary scale interval Fixed 1.0 �@�@�@�@�@�@�� Close �� Right-click on the numbers on the y-axis �� Add auxiliary gridlines �@�@�@(4) Delete points (markers) in the correspondence table from the graph. �@�@�@�@�@�@�@ Left-click on the graph area to activate it. �@�@�@�@�@�@�A Left-click �mInsert�n���mScatter plot�n���mSmooth line�n �@�@�@�@�@�@ 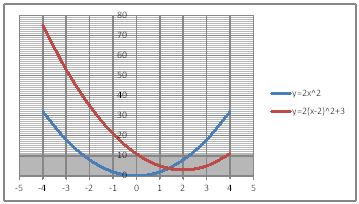 �@�@�@��Consideration 1�� �@�@�@�@�@�@�@Compare the spread of the graphs of y=2x^2 and y=2(x-2)^2+3. �@�@�@��Consideration 2�� �@�@�@�@�@�@�@State the positional relationship of the graphs of y=2x^2 and y=2(x-2)^2+3. �@�@�@��Consideration 3�� �@�@�@�@�@�@�@In general , what is the positional relationship between the graphs of y=ax^2 and y=a(x-b)^2+c. |
| �@�y�P�O�U�z Draw a graph of the quadratic functions of y=-x^2 and y=-x^2+6x-7. | ||||||||||||||||||||||||||||||||||||||||||||
| �@��Procedure�� �@�@�@(1) Create the following correspondence table on the worksheet. �@�@�@��Reference�� �@�@�@�@�@�@Please refer to �@�y�P�O�P�z how to enter the worksheet.
�@�@�@(2) Draw a graph from the correspondence table in (1) above. �@�@�@�@�@�@�@ Drag and select the cell range B11:D20 in the correspondence table of (1) above. �@�@�@�@�@�@�A Left-click �mInsert�n���mScatter plot�n���mSmooth line and Marker�n �@�@�@(3) Arrange the xy coordinate plane on which the graph is drawn. �@�@�@�@�@�@�@ Right-click on the numbers on the x-axis �� Axis formating �� Scale interval Fixed 1.0 �@�@�@�@�@�@�� Close �� Right-click on the numbers on the x-axis �� Add gridlines �@�@�@�@�@�@�A Right-click on the numbers on the y-axis �� Axis formating �� Auxiliary scale interval Fixed 1.0 �@�@�@�@�@�@�� Close �� Right-click on the numbers on the y-axis �� Add auxiliary gridlines �@�@�@(4) Delete points (markers) in the correspondence table from the graph. �@�@�@�@�@�@�@ Left-click on the graph area to activate it. �@�@�@�@�@�@�A Left-click �mInsert�n���mScatter plot�n���mSmooth line�n �@�@�@�@�@�@ 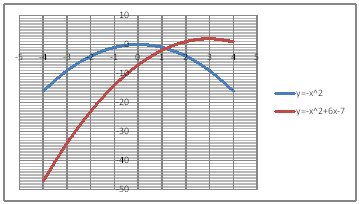 �@�@�@��Consideration 1�� �@�@�@�@�@�@�@Compare the spread of the graphs of y=-x^2 and y=-x^2+6x-7. �@�@�@��Consideration 2�� �@�@�@�@�@�@�@State the positional relationship of the graphs of y=-x^2 and y=-x^2+6x-7. |
| �@To table of contents�@ |
| �@�y�Q�O�P�z Draw a graph of the trigonometric functions of ������������ , �����������Q�� , and �����������R��. | |||||||||||||||||||||||||||||||||||||||||||||||||||||||
| �@��Procedure�� �@�@�@(1) Create the following correspondence table on the worksheet.
�@�@�@��Reference�� �@�@�@�@�@�sHow to complete the worksheet above�t �@�@�@�@�@�@�@Enter 0 in half-width in cell B12. �@�@�@�@�@�@�@Enter =B12+2 in half-width in cell B13. �@�@�@�@�@�@�@Right-click cell B13 and select Copy. �@�@�@�@�@�@�@Drag the cell range B14:B192 , right-click , and select Paste. �@�@�@�@�@�@�@Enter = SIN(RADIANS(B12)) in half-width in cell C12. �@�@�@�@�@�@�@Enter = SIN(RADIANS(2*B12)) in half-width in cell D12 �@�@�@�@�@�@�@Enter = SIN(RADIANS(3*B12)) in half-width in cell E12 �@�@�@�@�@�@�@Drag the cell range C12:E12 , right-click , and select Copy. �@�@�@�@�@�@�@Drag the cell range C13:C192 , right-click , and select Paste. �@�@�@(2) Draw a graph from the correspondence table in (1) above. �@�@�@�@�@�@�@ Drag and select the cell range B11:E192 in the correspondence table of (1) above. �@�@�@�@�@�@�A Left-click �mInsert�n���mScatter plot�n���mSmooth line�n �@�@�@�@�@�@�B Expand the graph area horizontally by dragging the right and left edges of the graph area. �@�@�@(3) Arrange the xy coordinate plane on which the graph is drawn. �@�@�@�@�@�@�@ Right-click on the numbers on the x-axis �� Axis formating �� Scale interval Fixed 30.0 �@�@�@�@�@�@�� Close �� Right-click on the numbers on the x-axis �� Add gridlines �@�@�@�@�@�@�A Right-click on the numbers on the x-axis �� Axis formating �� Auxiliary scale interval Fixed 10.0 �@�@�@�@�@�@�� Close �� Right-click on the numbers on the x-axis �� Add auxiliary gridlines �@�@�@�@�@�@ 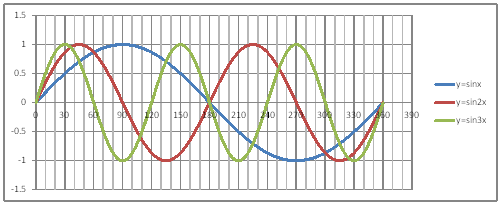 �@�@�@��Consideration 1�� �@�@�@�@�@�@�@�@Find the period of the graph of ������������ from the graph. �@�@�@��Consideration 2�� �@�@�@�@�@�@�@�@Find the period of the graph of ����������2x from the graph. �@�@�@��Consideration 3�� �@�@�@�@�@�@�@�@Find the period of the graph of �����������R�� from the graph.�@ �@�@�@��Consideration 4�� �@�@�@�@�@�@�@�@In general , what can be said about the period of the graph of y=sinax ? |
| �y�Q�O�Q�z Draw graphs of the trigonometric functions y=sinx and y=sin(x/2). | ||||||||||||||||||||||||||||||||||||||||||||
| �@��Procedure�� �@�@�@(1) Create the following correspondence table on the worksheet.
�@�@�@��Reference�� �@�@�@�@�@�sHow to complete the worksheet above�t �@�@�@�@�@�@�@Enter 0 in half-width in cell B12. �@�@�@�@�@�@�@Enter =B12+2 in half-width in cell B13. �@�@�@�@�@�@�@Right-click cell B13 and select Copy. �@�@�@�@�@�@�@Drag the cell range B14:B372 , right-click , and select Paste. �@�@�@�@�@�@�@Enter =SIN(RADIANS(B12)) in half-width in cell C12. �@�@�@�@�@�@�@Enter =SIN(RADIANS(B12/2)) in half-width in cell D12. �@�@�@�@�@�@�@Drag the cell range C12:D12 , right-click , and select Copy. �@�@�@�@�@�@�@Drag the cell range C13:D372 , right-click , and select Paste �@�@�@(2) Draw a graph from the correspondence table in (1) above. �@�@�@�@�@�@�@ Drag and select the cell range B11:D372 in the correspondence table of (1) above. �@�@�@�@�@�@�A Left-click �mInsert�n���mScatter plot�n���mSmooth line�n �@�@�@�@�@�@�B Expand the graph area horizontally by dragging the right and left edges of the graph area. �@�@�@(3) Arrange the xy coordinate plane on which the graph is drawn. �@�@�@�@�@�@�@ Right-click on the numbers on the x-axis �� Axis formating �� Scale interval Fixed 30.0 �@�@�@�@�@�@�� Close �� Right-click on the numbers on the x-axis �� Add gridlines �@�@�@�@�@�@�A Right-click on the numbers on the x-axis �� Axis formating �� Auxiliary scale interval Fixed 10.0 �@�@�@�@�@�@�@�� Close �� Right-click on the numbers on the x-axis �� Add auxiliary gridlines �@�@�@�@�@�@ 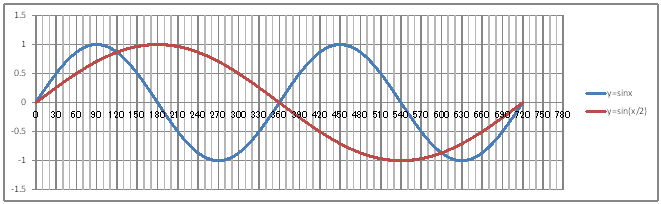 �@�@�@��Consideration 1�� �@�@�@�@�@�@�@Find the period of the graph of y=sin(x/2) from the graph ? �@�@�@��Consideration 2�� �@�@�@�@�@�@�@In general , �@�@�@�@�@�@�@what can be said about the period of the graph of y=sin(x/a) ? �@ |
| �@�y�Q�O�R�z Draw a graph of the trigonometric functions of y=sinx , y= 2sinx , and y=3sinx ? | |||||||||||||||||||||||||||||||||||||||||||||||||||||||
| �@��Procedure�� �@�@�@(1) Create the following correspondence table on the worksheet.
�@�@�@��Reference�� �@�@�@�@�@�sHow to complete the worksheet above�t �@�@�@�@�@�@�@Enter 0 in half-width in cell B12. �@�@�@�@�@�@�@Enter =B12+2 in half-width in cell B13. �@�@�@�@�@�@�@Right-click cell B13 and select Copy. �@�@�@�@�@�@�@Drag the cell range B14:B192 , right-click , and elect Paste. �@�@�@�@�@�@�@Enter =SIN(RADIANS(B12)) in half-width in cell C12. �@�@�@�@�@�@�@Enter =2*SIN(RADIANS(B12)) in half-width in cell D12. �@�@�@�@�@�@�@Enter =3*SIN(RADIANS(B12)) in half-width in cell E12. �@�@�@�@�@�@�@Drag the cell range C12:E12 , right-click , and elect Copy. �@�@�@�@�@�@�@Drag the cell range C13:C192 , right-click , and select Paste. �@�@�@(2) Draw a graph from the correspondence table in (1) above. �@�@�@�@�@�@�@ Drag and select the cell range B11:E192 in the correspondence table of (1) above. �@�@�@�@�@�@�A Left-click �mInsert�n���mScatter plot�n���mSmooth line�n �@�@�@�@�@�@�B Expand the graph area horizontally by dragging the right and left edges of the graph area. �@�@�@(3) Arrange the xy coordinate plane on which the graph is drawn. �@�@�@�@�@�@�@ Right-click on the numbers on the x-axis �� Axis formating �� Scale interval Fixed 30.0 �@�@�@�@�@�@�� Close �� Right-click on the numbers on the x-axis �� Add gridlines �@�@�@�@�@�@�A Right-click on the numbers on the x-axis �� Axis formating �� Auxiliary scale interval Fixed 10.0 �@�@�@�@�@�@�� Close �� Right-click on the numbers on the x-axis �� Add auxiliary gridlines �@�@�@�@�@�@ 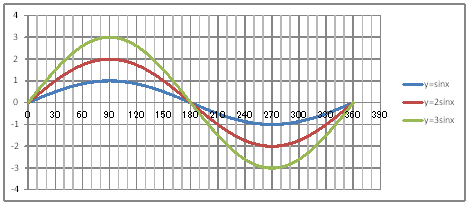 �@�@�@��Consideration 1�� �@�@�@�@�@�@�@�@Find the period of the graph of y=2sinx from the graph. �@�@�@��Consideration 2�� �@�@�@�@�@�@�@�@Find the period of the graph of y=3sinx from the graph. �@�@�@��Consideration 3�� �@�@�@�@�@�@�@�@State the difference between graphs y=sinx , y=2sinx , and y=3sinx. �@�@�@��Consideration 4�� �@�@�@�@�@�@�@�@In general , what can be said about the amplitude of the graph of y=asinx ? |
| �@�y�Q�O�S�z Draw a graph of the trigonometric function y=2sin(x-60��). | ||||||||||||||||||||||||||||||||||||||||||||
| �@��Procedure�� �@�@�@(1) Create the following correspondence table on the worksheet.
�@�@�@��Reference�� �@�@�@�@�@�sHow to complete the worksheet above.�t �@�@�@�@�@�@�@Enter 0 in half-width in cell B12. �@�@�@�@�@�@�@Enter =B12+2 in half-width in cell B13. �@�@�@�@�@�@�@Right-click cell B13 and select Copy. �@�@�@�@�@�@�@Drag the cell range B14:B222 , right-click , and select Paste. �@�@�@�@�@�@�@Enter =2*SIN(RADIANS(B12)) in half-width in cell C12. �@�@�@�@�@�@�@Enter =2*SIN(RADIANS(B12-60)) in half-width in cell D12. �@�@�@�@�@�@�@Drag the cell range C12:D12 , right-click , and select Copy. �@�@�@�@�@�@�@Drag the cell range C13:C222 , right-click , and select Paste. �@�@�@(2) Draw a graph from the correspondence table in (1) above. �@�@�@�@�@�@�@ Drag and select the cell range B11:D222 in the correspondence table of (1) above. �@�@�@�@�@�@�A Left-click �mInsert�n���mScatter plot�n���mSmooth line�n �@�@�@�@�@�@�B Expand the graph area horizontally by dragging the right and left edges of the graph area. �@�@�@(3) Arrange the xy coordinate plane on which the graph is drawn. �@�@�@�@�@�@�@ Right-click on the numbers on the x-axis �� Axis formating �� Scale interval Fixed 30.0 �@�@�@�@�@�@�� Close �� Right-click on the numbers on the x-axis �� Add gridlines �@�@�@�@�@�@�A Right-click on the numbers on the x-axis �� Axis formating �� Auxiliary scale interval Fixed 10.0 �@�@�@�@�@�@�� Close �� Right-click on the numbers on the x-axis �� Add auxiliary gridlines �@�@�@�@�@�@ 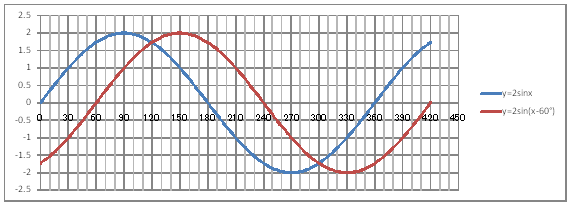 �@�@�@��Consideration�� �@�@�@�@�@�@�@Make sure that y=2sin(x-60��) graph is the y=2sinx graph translated +60�� along the x-axis. |
| �@�y�Q�O�T�z Draw a graph of the trigonometric functions y=cosx , y=cos2x , and y=cos3x. | |||||||||||||||||||||||||||||||||||||||||||||||||||||||
| �@��Procedure�� �@�@�@(1) Create the following correspondence table on the worksheet.
�@�@�@��Reference�� �@�@�@�@�@�sHow to complete the worksheet above�t �@�@�@�@�@�@�@Enter 0 in half-width in cell B12. �@�@�@�@�@�@�@Enter =B12+2 in half-width in cell B13. �@�@�@�@�@�@�@Right-click cell B13 and select Copy. �@�@�@�@�@�@�@Drag the cell range B14:B192 , right-click , and select Paste. �@�@�@�@�@�@�@Enter =COS(RADIANS(B12)) in half-width in cell C12. �@�@�@�@�@�@�@Enter =COS(RADIANS(2*B12)) in half-width in cell D12. �@�@�@�@�@�@�@Enter =COS(RADIANS(3*B12)) in half-width in cell E12. �@�@�@�@�@�@�@Drag the cell range C12:E12 , right-click , and select Copy. �@�@�@�@�@�@�@Drag the cell range C13:C192 , right-click , and select Paste. �@�@�@(2) Draw a graph from the correspondence table in (1) above. �@�@�@�@�@�@�@ Drag and select the cell range B11:E192 in the correspondence table of (1) above �@�@�@�@�@�@�A Left-click �mInsert�n���mScatter plot�n���mSmooth line�n �@�@�@�@�@�@�B Expand the graph area by horizontally by dragging the right and lrft edges of the graph area. �@�@�@(3) Arrange the xy coordinate plane on which the graph is drawn. �@�@�@�@�@�@�@ Right-click on the numbers on the x-axis �� Axis formating �� Scale interval Fixed 30.0 �@�@�@�@�@�@�� Close �� Right-click on the numbers on the x-axis �� Add gridlines �@�@�@�@�@�@�A Right-click on the numbers on the x-axis �� Axis formating �� Auxiliary scale interval Fixed 10.0 �@�@�@�@�@�@�� Close �� Right-click on the numbers on the x-axis �� Add auxiliary gridlines �@�@�@�@�@�@ 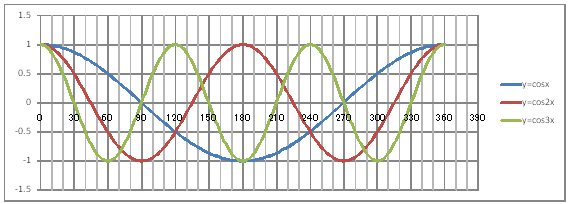 �@�@�@��Consideration 1�� �@�@�@�@�@�@�@�@Find the period of the graph of y=cosx from the graph. �@�@�@��Consideration 2�� �@�@�@�@�@�@�@�@Find the period of the graph of y=cos2x from the graph. �@�@�@��Consideration 3�� �@�@�@�@�@�@�@�@Find the period of the graph of y=cos3x from the graph. �@�@�@��Consideration 4�� �@�@�@�@�@�@�@�@In general , what can be said about the period of the graph of y=cosax ? |
| �@�y�Q�O�U�z Draw a graph of the trigonometric functions y=cosx and y=cos(x/2). | ||||||||||||||||||||||||||||||||||||||||||||
| �@��Procedure�� �@�@�@(1) Create the following correspondence table on the worksheet.
�@�@�@��Procedure�� �@�@�@�@�@�sHow to complete the worksheet above.�t �@�@�@�@�@�@�@Enter 0 in half-width in cell B12. �@�@�@�@�@�@�@Enter =B12+2 in half-width in cell B13. �@�@�@�@�@�@�@Right-click cell B13 and select Copy. �@�@�@�@�@�@�@Drag the cell range B14:B372 , right-click and select Paste. �@�@�@�@�@�@�@Enter =COS(RADIANS(B12)) in half-width in cell C12. �@�@�@�@�@�@�@Enter =COS(RADIANS(B12/2)) in half-width in cell D12. �@�@�@�@�@�@�@Drag the cell range C12:D12 , right-click and select Copy. �@�@�@�@�@�@�@Drag the cell range C13:C372 , right-click and select Paste. �@�@�@(2) Draw a graph from the correspondence table in (1) above. �@�@�@�@�@�@�@ Drag and select the cell range B11:D372 in the correspondence table of (1) above. �@�@�@�@�@�@�A Left-click �mInsert�n���mScatter plot�n���mSmooth line�n �@�@�@�@�@�@�B Expand the graph area horizontally by dragging the right and left edges of the graph area. �@�@�@(3) Arrange the xy coordinate plane on which the graph is drawn. �@�@�@�@�@�@�@ Right-click on the numbers on the x-axis �� Axis formatting �� Scale interval Fixed 30.00 �@�@�@�@�@�@�� Close �� Right-click on the numbers on the x-axis �� Add gridlines �@�@�@�@�@�@�A Right-click on the numbers on the x-axis �� Axis formating �� Auxiliary scale intercal Fixed 10.0 �@�@�@�@�@�@�� Close �� Right-click on the numbers on the x-axis �� Add auxiliary gridlines �@�@�@�@�@�@ 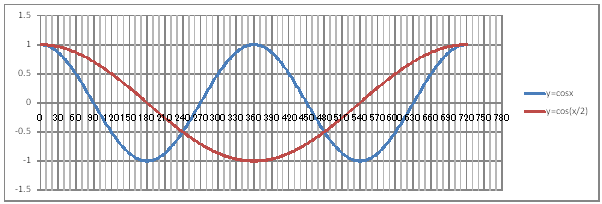 �@�@�@��Consideration 1�� �@�@�@�@�@�@�@Find the period of the graph of y=cos(x/2) . �@�@�@��Consideration 2�� �@�@�@�@�@�@�@In general, �@�@�@�@�@�@�@what can be said about the period of the graph of y=cos(x/a) ? |
| �@�y�Q�O�V�z Draw a graph of the trigonometric functions y=cosx , y=2cosx , and y=3cosx. | |||||||||||||||||||||||||||||||||||||||||||||||||||||||
| �@��Procedure�� �@�@�@(1) Create the following correspondence table on the worksheet.
�@�@�@��Reference�� �@�@�@�@�@�sHow to complete the worksheet above.�t �@�@�@�@�@�@�@Enter 0 in half-width in cell B12. �@�@�@�@�@�@�@Enter =B12+2 in half-width in cell B13. �@�@�@�@�@�@�@Right-click cell B13 , right-click , and select Copy. �@�@�@�@�@�@�@Drag the cell range B14:B192 , right-click , and select Paste. �@�@�@�@�@�@�@Enter =COS(RADIANS(B12)) in half-width in cell C12. �@�@�@�@�@�@�@Enter =2*COS(RADIANS(B12)) in half-width in cell D12. �@�@�@�@�@�@�@Enter =3*COS(RADIANS(B12)) in half-width in cell E12. �@�@�@�@�@�@�@Drag the cell range C12:E12 , right-click , and select Copy. �@�@�@�@�@�@�@Drag the cell range C13:C192 , right-click , and select Paste. �@�@�@(2) Draw a graph from the correspondence table in (1) above. �@�@�@�@�@�@�@ Drag and select the cell range B11:E192 in the correspondence table of (1) above. �@�@�@�@�@�@�A Left-click �mInsert�n���mScatter plot�n���mSmooth line�n �@�@�@�@�@�@�B Expand the graph area horizontally by dragging the right and left edges of the graph area. �@�@�@(3) Arrange the xy coordinate plane on which the graph is drawn. �@�@�@�@�@�@�@ Right-click on the numbers on the x-axis �� Axis formating �� Scale interval Fixed 30.0 �@�@�@�@�@�@�� Close �� Right-click on the numbers on the x-axis �� Add gridlines �@�@�@�@�@�@�A Right-click on the numbers on the x-axis �� Axis formating �� Auxiliary scale interval Fixed 10.0 �@�@�@�@�@�@�� Close �� Right-click on the numbers on the x-axis �� Add auxiliay gridlines �@�@�@�@�@�@  �@�@�@��Consideration 1�� �@�@�@�@�@�@�@�@Find the period of the graph of y=2cosx from the graph. �@�@�@��Consideration 2�� �@�@�@�@�@�@�@�@Find the period of the graph of y=3cosx from the graph �@�@�@��Consideration 3�� �@�@�@�@�@�@�@�@State the difference between graph ������������ , graph �����Q�������� , and graph �����R��������. �@�@�@��Consideration 4�� �@�@�@�@�@�@�@�@In general , what can be said about the amplitude of the graph of �������������� ? |
| �@�y�Q�O�W�z Draw a graph of the trigonometric function y=2cos(x+60��). | ||||||||||||||||||||||||||||||||||||||||||||
| �@��Procedure�� �@�@�@(1) Create the following correspondence table on the worksheet. �@�@�@
�@�@�@��Reference�� �@�@�@�@�@�sHow to complete the worksheet above�t �@�@�@�@�@�@�@Enter -60 in half-width in cell B12. �@�@�@�@�@�@�@Enter =B12+2 in half-width in cell B13. �@�@�@�@�@�@�@Right-click cell B13 and select Copy. �@�@�@�@�@�@�@Drag the cell range B14:B222 , right-click , and select Paste. �@�@�@�@�@�@�@Enter =2*cos(RADIANS(B12)) in half-width in cell C12. �@�@�@�@�@�@�@Enter =2*cos(RADIANS(B12+60)) in half-width in cell D12. �@�@�@�@�@�@�@Drag the cell range C12:D12, right-click , and select Copy. �@�@�@�@�@�@�@Drag the cell range C13:C222 , right-click , and select Paste. �@�@�@(2) Draw a graph from the correspondence table in (1) above. �@�@�@�@�@�@�@ Drag and select the cell range B11:D222 on the correspondence table of (1) above. �@�@�@�@�@�@�A Left -click �mInsert�n���mScatter plot�n���mSmooth line�n �@�@�@�@�@�@�B Expand the graph area horizontally by dragging the right and left edges of the graph area. �@�@�@(3) Arrange the xy coordinate plane on which the graph is drawn. �@�@�@�@�@�@�@ Right-click on the numbers on the x-axis �� Axis formating �� Scale interval Fixed 30.0 �@�@�@�@�@�@�� Close �� Right-click on the numbers on the x-axis �� Add gridlines �@�@�@�@�@�@�A Right-click on the numbers on the x-axis �� Axis formating �� Auxiliary scale interval Fixed 10.0 �@�@�@�@�@�@�� Close �� Right-click on the numbers on the x-axis �� Add auxiliary gridlines �@�@�@�@�@�@  �@�@�@��Consideration�� �@�@�@�@�@�@�@Make sure that the graph of y=2cos(x+60��) �@is the graph of y=2cosx that has been translated by -60 ��in the x-axis direction. |
| �@�y�Q�O�X�z Draw a graph of the trigonometric function y=tanx. | |||||||||||||||||||||||||||||||||||||||||||||||||||||||||||||||||||||||||||
| �@��Procedure�� �@�@�@(1) Create the following correspondence table on the worksheet.
�@�@�@��Reference�� �@�@�@�@�@�sHow to complete the worksheet above�t �@�@�@�@�@�@�@Enter -180 in half-width in cell B12. �@�@�@�@�@�@�@Enter =B12+2 in half-width in cell B13. �@�@�@�@�@�@�@Right-click cell B13 and select Copy. �@�@�@�@�@�@�@Drag the cell range B14:B56 , right-click , and select Paste. �@�@�@�@�@�@�@Enter -88 in half-width in cell B58. �@�@�@�@�@�@�@Enter =B58+2 in half-width in cell B59. �@�@�@�@�@�@�@Right-click cell B59 and select Copy. �@�@�@�@�@�@�@Drag the cell range B60:B146 , right-click , and select Paste. �@�@�@�@�@�@�@Enter 92 in half-width in cell B148. �@�@�@�@�@�@�@Enter =B148+2 in half-width in cell B149. �@�@�@�@�@�@�@Right-click cell B149 and select Copy. �@�@�@�@�@�@�@Drag the cell range B150:B192 , right-click , and select Paste. �@�@�@�@�@�@�@Enter =TAN(RADIANS(B12)) in half-width in cell C12. �@�@�@�@�@�@�@Right-click cell C12 and select Copy. �@�@�@�@�@�@�@Drag the cell range C13:C192 , right-click , and select Paste. �@�@�@(2) Draw a graph from the correspondence table in (1) avobe. �@�@�@�@�@�@�@ Drag and select the cell range B11:C192 in the correspondence table of (1) above. �@�@�@�@�@�@�A Left-click �mInsert�n���mScatter plot�n���mSmooth line�n �@�@�@�@�@�@�B Expand the graph area horizontally by dragging the right and left edges of the graph area. �@�@�@(3) Arrange the xy coordinate plane on which the graph is drawn. �@�@�@�@�@�@�@ Right-click on the numbers on the x-axis �� Axis formating �� Scale interval Fixed 30.0 �@�@�@�@�@�@�� Close �� Right-click on the numbers on the x-axis �� Add gridlines �@�@�@�@�@�@�A Right-click on the numbers on the x-axis �� Axis formating �� Auxiliary scale interval Fixed 10.0 �@�@�@�@�@�@�� Close �� Right-click on the numbers on the x-axis �� Add auxiliary gridlines �@�@�@�@�@�@  �@�@�@��Consideration 1�� �@�@�@�@�@�@�@�@Find the period of the graph of y=tanx from the graph. �@�@�@��Consideration 2�� �@�@�@�@�@�@�@�@Make sure that the straight lines x=90��and x=-90��are asymptote.�@ |
| �@�y�Q�P�O�z Draw a graph of the trigonometric function of y=tan2x. | |||||||||||||||||||||||||||||||||||||||||||||||||||||||||||||||||||||||||||
| �@��Procedure�� �@�@�@(1) Create the following correspondence table on the worksheet.
�@��Reference�� �@�@�@�@�@�sHow to complete the woksheet above�t �@�@�@�@�@�@�@Enter -90��in half-width in cell B12. �@�@�@�@�@�@�@Enter =B12+1 in half-width in cell B13. �@�@�@�@�@�@�@Right-click cell B13 and select Copy. �@�@�@�@�@�@�@Drag the cell range B14:B56 , right-click , and select Paste. �@�@�@�@�@�@�@Enter -44 in half-width in cell B58. �@�@�@�@�@�@�@Enter =B58+1 in half-width in cell B59. �@�@�@�@�@�@�@Right-click cell B59 and select Copy. �@�@�@�@�@�@�@Drag the cell range B60:B146 , right-click , and select Paste. �@�@�@�@�@�@�@Enter 46 in half-width in cell B148. �@�@�@�@�@�@�@Enter =B148+1 in half-width in cell B149. �@�@�@�@�@�@�@Right-click cell B149 and select Copy. �@�@�@�@�@�@�@Drag the cell range B150:B192 , right-click , and select Paste. �@�@�@�@�@�@�@Enter =TAN(RADIANS(2*B12)) in half-width in cell C12. �@�@�@�@�@�@�@Right-click cell C12 and select Copy. �@�@�@�@�@�@�@Drag the cell range C13:C192 , right-click , and select Paste. �@�@�@(2) Draw a graph from the correspondence table in (1) above. �@�@�@�@�@�@�@ Drag and select the cell range B11:C192 in the correspnndencetable of (1) above. �@�@�@�@�@�@�A Left-click �mInsert�n���mScatter plot�n���mSmooth line�n �@�@�@�@�@�@�B Expand the graph area horizontally by dragging the right and left edges of graph area. �@�@�@(3) Arrange the xy coordinate plane on which the graph is drawn. �@�@�@�@�@�@�@ Right-click on the numbers on the x-axis �� Axis formating �� Scale interval 15.0 �@�@�@�@�@�@�� Close �� Right-click on the numbers on the x-axis �� Add gridlines �@�@�@�@�@�@�A Right-click on the numbers on the x-axis �� Axis formating �� Auxiliary scale interval 5.0 �@�@�@�@�@�@�� Close �� Right-click on the numbers on the x-axis �� Add auxiliary gridlines �@�@�@�@�@�@  �@�@�@��Consideration 1�� �@�@�@�@�@�@�@�@Find the period of the graph of y=tan2x from the graph.�@ �@�@�@��Consideration 2�� �@�@�@�@�@�@�@�@Make sure that the straight lines x=45��and x=-45��are asymptote. �@�@�@��Consideration 3�� �@�@�@�@�@�@�@�@In general , what can be said about the period of th graph of y=tanax ? |
| �@�y�Q�P�P�z Draw a graph of the trigonometric functions y=tanx and y=2tanx. | ||||||||||||||||||||||||||||||||||||||||||||||||||||||||||||||||||||||||||||||||||||||||||||||||||||
| �@��Procedure�� �@�@�@(1) Create the following correspondence table on the worksheet. �@�@�@�@�@�@�@��Reference�� �@�@�@�@�@�@�@�@�@�@Please refer to �y�Q�O�X�z how to complete the worksheet.
�@�@�@(2) Draw a graph from the correspondence table in (1) above. �@�@�@�@�@�@�@ Drag and select the cellrange B11:D192 in the correspondence table of (1) above. �@�@�@�@�@�@�A Left-click �mInsert�n���mScatter plot�n���mSmooth line�n �@�@�@�@�@�@�B Expand the graph area vertically and horizontally by dragging the top and bottom edges and the �@�@�@�@�@�@�@right and left edges of the graph area. �@�@�@(3) Arrange the xy coordinate plane on which the graph is drawn. �@�@�@�@�@�@�@ Right-click on the number on the x-axis �� Axis formating �� Scale interval Fixed 15.0 �@�@�@�@�@�@�� Close �� Right-click on the number on the x-axis �� Add gridlines �@�@�@�@�@�@�A Right-click on the number on the x-axis �� Axis formating �� Auxiliary scale interval Fixed 5.0 �@�@�@�@�@�@�� Close �� Right-click on the number on the x-axis �� Add auxiliary gridlines �@�@�@�@�@ �B Right-click on the number on the y-axis �� Axis-formating �� Auxiliary scale interval Fixed 1.0 �@�@�@�@�@�@�� Close �� Right-click on the number on the y-axis �� Add auxiliary gridlines �@�@�@�@�@�@ 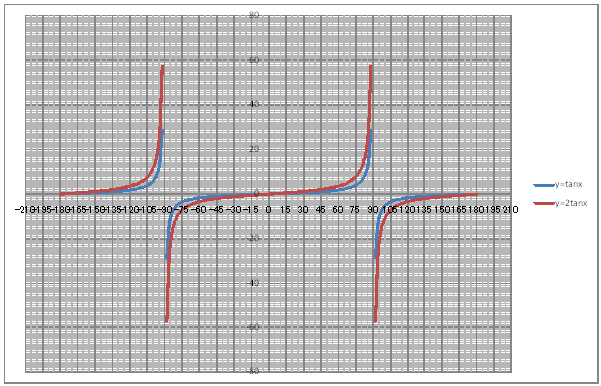 �@�@�@��Consideration 1�� �@�@�@�@�@�@�@�@Find the period of the graph of y=2tanx from the graph. �@�@�@��Consideration 2�� �@�@�@�@�@�@�@�@State the positional relationship between the graphs of ������������ and �����Q��������. �@�@�@��Consideration 3�� �@�@�@�@�@�@�@�@In general , what is the positional relationship between the graphs of ������������ and ��������������. |
| �@�y�Q�P�Q�z Draw a graph of the trigonometric function y=2tan{(1/2))x-30��}. | |||||||||||||||||||||||||||||||||||||||||||||||||||||||||||||||||||||||||||
| �@��Procedure�� �@�@�@(1) Create the following correspondence table on the worksheet. �@�@�@�@�@�@�@��Reference�� �@�@�@�@�@�@�@�@�@�@Please refer to �y�Q�O�X�z how to complete the worksheet.
�@�@�@(2) Draw a graph from the correspondence table in (1) above. �@�@�@�@�@�@�@ Drag and select the cell range B11:C372 in the correspondence table of (1) above. �@�@�@�@�@�@�A Left-click �mInsert�n���mScatter plot�n���mSmooth lines�n. �@�@�@�@�@�@�B Expand the graph area vertically and horizontally by dragging the right and reft edges and the top and bottom edges of the graph area. �@�@�@(3) Arrange the xy coordinate plane on which the graph is drawn. �@�@�@�@�@�@�@ Right-click on the numbers on the x-axis �� Axis formating �� Scale interval Fixed 30.0 �@�@�@�@�@�@�� Close �� Right-click on the numbers on the x-axis �� Add gridlines �@�@�@�@�@�@�A Right-click on the numbers on the x-axis �� Axis formating �� Auxiliary scale interval Fixed 10.0 �@�@�@�@�@�@�� Close �� Right-click on the numbers on the x-axis �� Add auxiliary gridlines �@�@�@�@�@�@ 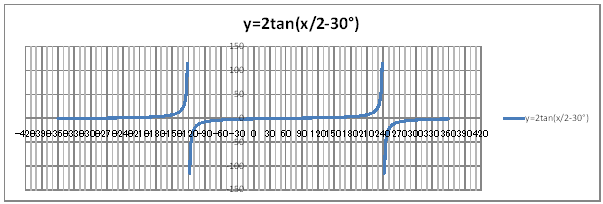 �@�@�@��Consideration 1�� �@�@�@�@�@�@�@Make sure that the straight lines x=240�� and x=-120�� are asymptote of the graph�@of y=2tan{(1/2)x-30��} �@�@�@��Consideration 2�� �@�@�@�@�@�@�@Make sure that the graph of y=2tan(1/2)x is translated by +60 in the x-axis direction. |
| �@�y�Q�P�R�z When 0��������360�� �@�@�@�@�@�@Draw a graph of the functions y=cos2x+2sinx+2 and y=-2(sinx)^2+2sinx+3. |
|||||||||||||||||||||||||||||||||||||||||||||||||||||||
| �@��Procedure�� �@�@�@(1) Create the following correspondence table on the worksheet.
�@�@�@��Reference�� �@�@�@�@�@�sHow to complete the worksheet above�t �@�@�@�@�@�@�@Enter 0 in half-width in cell B12. �@�@�@�@�@�@�@Enter =B12+2 in half-width in cell B13. �@�@�@�@�@�@�@Right-click on cell B13 and select Copy. �@�@�@�@�@�@�@Drag the cell range B14:B192 , right-click , and select Paste. �@�@�@�@�@�@�@Enter 0 in half-width in cell D12. �@�@�@�@�@�@�@Enter =D12+2 in half-width in cell D13. �@�@�@�@�@�@�@Right-click on cell D13 and select Copy. �@�@�@�@�@�@�@Drag the cell range D14:D192 , right-click , and select Paste. �@�@�@�@�@�@�@Enter =COS(RADIANS(2*B12))+2*SIN(RADIANS(B12))+2�@in half-width in cell C12. �@�@�@�@�@�@�@Enter =-2SIN(RADIANS(B12))^2+2*SIN(RADIANS(B12))+3�@in half-width in cell E12. �@�@�@�@�@�@�@Right-click on cell D12 and select Copy. �@�@�@�@�@�@�@Drag the cell range C13:C192 , right-click , and select Paste. �@�@�@�@�@�@�@Right-click on cell E12 and select Copy. �@�@�@�@�@�@�@Drag the cell range E13:E192 , right-click , and select Paste. �@�@�@(2) Draw a graph from the correspondence table in (1) avove. �@�@�@�@�@�@�@ Drag and select the cell range B11:C192 in the correspondence table of (1) above. �@�@�@�@�@�@�A Left-click �mInsert�n���mScatter plot�n���msmooth line�n �@�@�@�@�@�@�B Expand the graph area horizontally by dragging the right and left edges of the graph area. �@�@�@�@�@�@�C Drag and select the cell range D11:E192 in the correspondence table of (1) above. �@�@�@�@�@�@�D Left-click �mInsert�n���mScatter plot�n���mSmooth line�n �@�@�@�@�@�@�E Expand the graph area horizontally by dragging the right and left edges of the graph area. �@�@�@(3) Arrange the xy coordinate plane on which the graph is drawn. �@�@�@�@�@�@�@ Right-click on the numbers on the x-axis �� Axis formating �� Scale interval Fixed 30.0 �@�@�@�@�@�@�� Close �� Right-click on the numbers on the x-axis �� Add gridlines �@�@�@�@�@�@�A Right-click on the numbers on the x-axis �� Axis formating �� Auxiliary scale interval Fixed 10.0 �@�@�@�@�@�@�� Close �� Right-click on the numbers on the x-axis �� Add auxiliary gridlines �@�@�@�@�@�@ 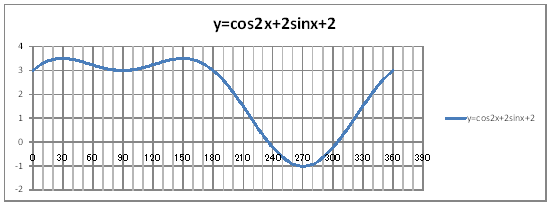 �@�@�@�@�@�@ 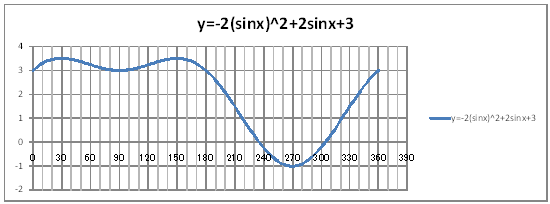 �@�@�@���l�@�� �@�@�@�@�@�@�@Make sure that the graphs for y=cos2x+2sinx+2 and y=-2(sinx)^2+2sinx+3 are the same. |
| �@�y�Q�P�S�z When 0��������360�� �@�@�@�@�@�@Draw a graph of the functions of y=sinx+cosx and y=��2sin(x+45��). |
|||||||||||||||||||||||||||||||||||||||||||||||||||||||
| �@��Procedure�� �@�@�@(1) Create the following correspondence tabe on the worksheet.
�@�@�@��Reference���sHow to complete the worksheet above�t �@�@�@�@�@�@Enter 0 in half-width in cell B12. �@�@�@�@�@�@Enter =B12+2 in half-width in cell B13. �@�@�@�@�@�@Right-click cell B13 amd select Copy. �@�@�@�@�@�@Drag the cell range B14:B192 , Right-click , and select Paste. �@�@�@�@�@�@Enter 0 in half-width in cell D12. �@�@�@�@�@�@Enter =D12+2 in half-width in cell D13. �@�@�@�@�@�@Right-click cell D13 amd select Copy. �@�@�@�@�@�@Drag the cell range D14:D192 , Right-click , and select Paste. �@�@�@�@�@�@Enter =SIN(RADIANS(B12))+COS(RADIANS(B12)) in half-width in cell C12. �@�@�@�@�@�@Enter =SQRT(2)*SIN(RADIANS(B12+45)) in half-width in cell E12. �@�@�@�@�@�@Right-click cell C12 amd select Copy. �@�@�@�@�@�@Drag the cell range C13:C192 , Right-click , and select Paste. �@�@�@�@�@�@Right-click cell E12 amd select Copy. �@�@�@�@�@�@Drag the cell range E13:E192 , Right-click , and select Paste. �@�@�@(2) Draw a graph from the correspondence table in (1) above. �@�@�@�@�@�@�@ Drag and select the cell range B11:C192 in the correspondence table of (1) above. �@�@�@�@�@�@�A Left-click �mInsert�n���mScatter plot�n���mSmooth line�n �@�@�@�@�@�@�B Expand the graph area horizontally by dragging the right and left edges of the graph area. �@�@�@�@�@�@�C Drag and select the cell range D11:E192 in the correspondence table of (1) above. �@�@�@�@�@�@�D Left-click �mInsert�n���mScatter plot�n���mSmooth line�n �@�@�@�@�@�@�E Expand the graph area horizontally by dragging the right and left edges of the graph area. �@�@�@(3) Arrange the xy coordinate plane on which the graph is drawn. �@�@�@�@�@�@�@ Right-click on the numbers on the x-axis �� Axis formating �� Scale interval Fixed 30.0 �@�@�@�@�@�@�� Close �� Right-click on the numbers on the x-axis �� Add gridlines �@�@�@�@�@�@�A Right-click on the numbers on the x-axis �� Axis formating �� Auxiliary scale interval Fixed 10.0 �@�@�@�@�@�@�� Close �� Right-click on the numbers on the x-axis �� Add auxiliary gridlines �@�@�@�@�@�@ 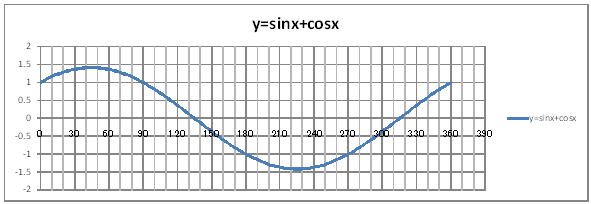 �@�@�@�@�@�@ 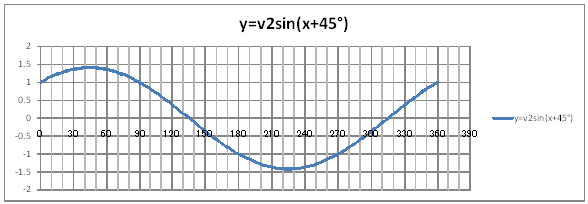 �@�@�@��Consideration�� �@�@�@�@�@�@�@Make sure that the gtaphs for �������������{�������� and y=��2sin(x+45��)�@are the same. |
| �@To table of contents�@ |
| �@�y�R�O�P�z Draw a graph of the exponential functions of y=2^x , y=3^x , and y=4^x. | |||||||||||||||||||||||||||||||||||
| �@ �@��Procedure�� �@�@�@(1) Create the following correspondence table on the worksheet.
�@�@�@��Reference�� �@�@�@�@�@�sHow to complete the worksheet above�t �@�@�@�@�@�@�@Enter -2 in half-width in cell B12. �@�@�@�@�@�@�@Enter =B12+1 in half-width in cell B13. �@�@�@�@�@�@�@Right-click B13 and select Copy. �@�@�@�@�@�@�@Drag the cell range B14:B16, right-click , and select Paste. �@�@�@�@�@�@�@Enter =POWER(2,B12) in half-width in cell C12. �@�@�@�@�@�@�@Enter =POWER(3,B12) in half-width in cell D12. �@�@�@�@�@�@�@Enter =POWER(4,B12) in half-width in cell E12. �@�@�@�@�@�@�@Drag the cell range C12:E12, right-click , and select Copy �@�@�@�@�@�@�@Drag the cell range C13:C16 , right-click , and select Paste �@�@�@(2) Draw a graph from the correspondence table in (1) above. �@�@�@�@�@�@�@ Drag and select the cell range B11:E16 in the correspondence table of (1) above. �@�@�@�@�@�@�A Left-click �mInsert�n���mScatter plot�n���mSmooth lines and Marker] �@�@�@�@�@�@�B Expand the graph area vertically by dragging the top and bottom edges of the graph area. �@�@�@(3) Arrange the xy coordinate plane on which the graph is drawn. �@�@�@�@�@�@�@ Right-click on the numbers on the x-axis �� Axis formating �� Scale interval Fixed 1.0 �@�@�@�@�@�@�� Close �� Right-click on the numbers on the x-axis �� Add gridlines �@�@�@�@�@�@�A Right-click on the numbers on the y-axis �� Axis formating �� Scale interval Fixed 1.0 �@�@�@�@�@�@�� Close �@�@�@�@�@�@�B Right-click on the numbers on the y-axis �� Axis formating �� Auxiliary scale interval Fixed 0.5 �@�@�@�@�@�@�� Close �� Right-click on the numbers on the y-axis �� Add auxiliary gridlines �@�@�@(4) Delete the points(markers) in the correspondence table from the graph. �@�@�@�@�@�@�@ Left-click on the graph area to activate it. �@�@�@�@�@�@�A Left-click �mInsert�n���mScatter plot�n���mSmooth line�n �@�@�@�@�@�@ 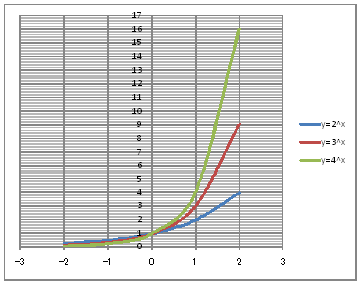 �@�@�@��Consideration 1�� �@�@�@�@�@�@�@Find the coordinates of the point through which the graphs of y=2^x , y=3^x , and y=4^x commonly pass. �@�@�@��Consideration 2�� �@�@�@�@�@�@�@Find the asymptote that the graphs of y=2^x , y=3^x , and y=4^x have in common. �@�@�@��Consideration 3�� �@�@�@�@�@�@�@State the difference between graphs y=2^x , y=3^x , and y=4^x. |
| �@�y�R�O�Q�z Draw a graph of the exponential functions of y=(1/2)^x , y=(1/3)^x , and y=(1/4)^x. | |||||||||||||||||||||||||||||||||||
| �@��Procedure�� �@�@�@(1) Create the following correspondence table on the worksheet. �@�@�@��Reference�� �@�@�@�@�@�@Refer to �y�R�O�P�z how to complete the worksheet.
�@�@�@(2) Draw a graph from the correspondence table in (1) above. �@�@�@�@�@�@�@ Drag and select the cell range B11:E16 in the correspondence table of (1) above. �@�@�@�@�@�@�A Left-click �mInsert�n���mScatter plot�n���mSmooth line and Marker�n. �@�@�@�@�@�@�B Expand the graph area vertically by dragging the top and bottom edges of the graph area. �@�@�@(3) Arrange the xy coordinate plane on which the graph is drawn. �@�@�@�@�@�@�@ Right-click on the numbers on the x-axis �� Axis formating �� Scale interval Fixed 1.0 �@�@�@�@�@�@�� Close �� Right-click on the numbers on the x-axis �� Add gridlines �@�@�@�@�@�@�A Right-click on the numbers on the y-axis �� Axis formating �� Scale interval Fixed 1.0 �@�@�@�@�@�@�� Close �@�@�@�@�@�@�B Right-click on the numbers on the y-axis �� Axis formating �� Auxiliary scale interval Fixed 0.5 �@�@�@�@�@�@�� Close �� Right-click on the numbers on the y-axis �� Add auxiliary gridlines �@�@�@(4) Delite the points(markers) in the correspondence table from the graph. �@�@�@�@�@�@�@ Left-click on the graph area to activate it. �@�@�@�@�@�@�A Left-click �mInsert�n���mScatter plot�n���mSmooth line�n. �@�@�@�@�@�@ 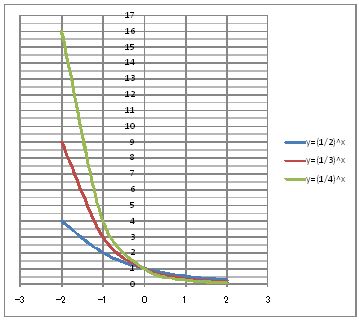 �@�@�@��Consideration 1�� �@�@�@�@�@�@�@Find the coordinates of the point through which the graphs of y=(1/2)^x , y=(1/3)^x , and y=(1/4)^x commonly pass. �@�@�@��Consideration 2�� �@�@�@�@�@�@�@Find the asymptote that the graphs of y=(1/2)^x , y=(1/3)^x , and y=(1/4)^x have in common. �@�@�@��Consideration 3�� �@�@�@�@�@�@�@State the difference between the graphs y=(1/2)^x , y=(1/3)^x , and y=(1/4)^x. |
| �@�y�R�O�R�z Draw a graph of the exponential functions of y=2^x and y=(1/2)^x . | ||||||||||||||||||||||||||||||||||||
�@��Procedure�� �@�@�@(1) Create the following correspondence table on the worksheet. �@�@�@��Reference�� �@�@�@�@�@�@Please refer to �y�R�O�P�z how to complete the worksheet
�@�@�@(2) Draw a graph from the correspondence table in (1) above. �@�@�@�@�@�@�@ Drag and select the cell range B11:D18 in the correspondence table of (1) above. �@�@�@�@�@�@�A Left-click �mInsert�n���mScatter plot�n���mSmooth line snd marker�n. �@�@�@�@�@�@�B Expand the graph area vertically by dragging the top and bottom edges of the graph area. �@�@�@(3) Arrange the xy coordinate plane on which the graph is drawn. �@�@�@�@�@�@�@ Right-click on the numbers on the x-axis �� Axis formating �� Scale interval Fixed 1.0 �@�@�@�@�@�@�� Close �� Right-click on the numbers on the x-axis �� Add gridlines �@�@�@�@�@�@�A Right-click on the numbers on the y-axis �� Axis formating �� Scale interval Fixed 1.0 �@�@�@�@�@�@�� Close �@�@�@�@�@�@�B Right-click on the numbers on the y-axis �� Axis formating �� Auxiliary scale interval Fixed 0.5 �@�@�@�@�@�@�� Close �� Right-click on the numbers on the y-axis �� Add auxiliary gridlines �@�@�@(4) Delete the points(markers) in the correspondence table from the graph. �@�@�@�@�@�@�@ Left-click on the graph area to activate it. �@�@�@�@�@�@�A Left-click �mInsert�n���mScatter plot�n���mSmooth line�n. �@�@�@�@�@�@ 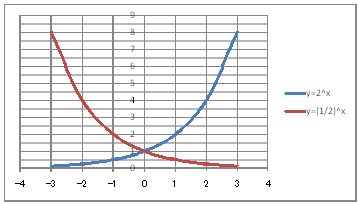 �@�@�@��Consideration 1�� �@�@�@�@�@�@�@State the positional relationship of the graphs of y=2^x and y=(1/2)^x. �@�@�@��Consideration 2�� �@�@�@�@�@�@�@In general , what is the positional relationship between graphs y=a^x and y=(1/a)^x ? |
| �@�y�R�O�S�z Draw a graph of the exponential functions of y=2^x , y=2^(x-2) , and y=2^(x+2). | |||||||||||||||||||||||||||||||||||||||||||||
| �@��Procedure�� �@�@�@(1) Create the following correspondence table on the worksheet. �@�@�@��Reference�� �@�@�@�@�@Please refer to �y�R�O�P�z how to complete the worksheet.
�@�@�@(2) Draw a graph from the correspondence table in (1) above. �@�@�@�@�@�@�@ Drag and select the cell range B11:E18 in the correspondence table of (1) above. �@�@�@�@�@�@�A Left-click �mInsert�n���mScatter plot�n���mSmooth line and Marker�n. �@�@�@�@�@�@�B Expand the graph area horizontally by dragging the right and left edges of the graph area. �@�@�@(3) Arrange the xy coordinate plane on which the graph is drawn. �@�@�@�@�@�@�@ Right-click on the numbers on the x-axis �� Axis formating �� Scale interval Fixed 1.0 �@�@�@�@�@�@�� Close �� Right-click on the numbers on the x-axis �� Add gridlines �@�@�@�@�@�@�A Right-click on the numbers on the y-axis �� Axis formating �� Scale interval Fixed 5.0 �@�@�@�@�@�@�� Close �@�@�@�@�@�@�B Right-click on the numbers on the y-axis �� Axis formating �� Auxiliary scale interval Fixed 1.0 �@�@�@�@�@�@�� Close �� Right-click on the numbers on the y-axis �� Add auxiliary gridlines �@�@�@(4) Delete the points(markers) in the correspondence table from the graph. �@�@�@�@�@�@�@ Left-click on the graph area to activate it. �@�@�@�@�@�@�A Left-click �mInsert�n���mScatter plot�n���mSmooth line�n. �@�@�@�@�@�@ 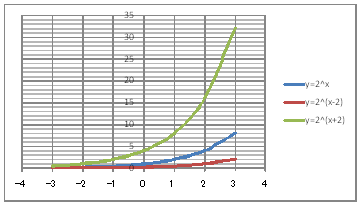 �@�@�@��Consideration 1�� �@�@�@�@�@�@�@State the positional relationship of the graph of y=2^x , y=2^(x-2) , and y=2^(x+2). �@�@�@��Consideration 2�� �@�@�@�@�@�@�@In general , what is the positional relationship between graphs y=a^x and y=a^(x-k). |
| �@�y�R�O�T�z Solve the equation 4^x�@-�@2^(x+2)�@=�@32 using a graph | ||||||||||||||||||||||||||||||||||||||||||||
| �@��Procedure�� �@�@�@�@�@�@�@�@ �@�@�@�@�@�@�@�@Draw the graphs of y=4^x and y=2^(x+2) +32. �@�@�@(1) Create the following correspondence table on a worksheet. �@�@�@��Reference�� �@�@�@�@�@�@Please refer to �y�R�O�P�z how to complete the worksheet.
�@�@�@(2) Draw a graph from the correspondence table in (1) above. �@�@�@�@�@�@�@ Drag and select the cell range B11:D20 in the correspondence table of (1) above. �@�@�@�@�@�@�A Left-click �mInsert�n���mScatter plot�n���mSmooth line and Merker�n �@�@�@�@�@�@�B Expand the graph area vertically by dragging the top and bottom edges of the graph area. �@�@�@(3) Arrange the xy coordinate plane on which the graph is drawn. �@�@�@�@�@�@�@ Right-click on the numbers on the x-axis �� Axis formatting �� Scale interval Fixed 1.0 �@�@�@�@�@�@�� close �� Right-click on the numbers on the x-axis �� Add gridlines �@�@�@�@�@�@�A Right-click on the numbers on the y-axis �� Axis formatting �� Auxiliary scale interval Fixed 10.0 �@�@�@�@�@�@�@�� close �� Right-click on the numbers on the y-axis �� Add auxiliary gridlines �@�@�@(4) Delete the points(markers) in the correspondence table from the graph. �@�@�@�@�@�@�@ Left-click the graph area to activare. �@�@�@�@�@�@�A Left-click �mInsert�n���mScatter plot�n���mSmooth line�n �@�@�@�@�@�@ 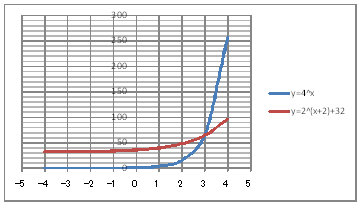 �@�@�@��Consideration�� �@�@�@�@�@�@Solve the equation 4^x-2^(x+2)=32 from the intersection of the graphs y=4^x and y=2^(x+2)+32 |
| �@�y�R�O�U�z Solve the inequality 9^x�@<�@2�3^x�@+�@3 using a graph. | ||||||||||||||||||||||||||||
| �@��Procedure�� �@�@�@�@�@�@�@�@Draw the graphs y=9^x and y=2�3^x+3 �@�@�@(1) Create the following correspondence table on a worksheet. �@�@�@��Reference�� �@�@�@�@�@�@Please refer to �y�R�O�P�z how to complete the worksheet.
�@�@�@(2) Draw a graph from the correspondence table in (1) above. �@�@�@�@�@�@�@ Drag and select the cell range B11:D16 in the correspondence table of (1) above. �@�@�@�@�@�@�A Left-click �mIncert�n���mScatter plot�n���mSmooth line and Marker] �@�@�@�@�@�@�B Expand the graph area vertially by dragging the top and bottom edges of the graph area. �@�@�@(3) Arrange the xy coordinate plane on which the graph is draw. �@�@�@�@�@�@�@ Right-click on the numbers on the x-axis �� Axis formatting �� Scale interval Fixed 1.0 �@�@�@�@�@�@�� close �� Right-click on the numbers on the x-axis �� Add gridlines �@�@�@�@�@�@�A Right-click on the numbers on the y-axis �� Axis formatting �� Auxiliary Scale interval Fixed 1.0 �@�@�@�@�@�@�� close �� Right-click on the numbers on the y-axis �� Auxliary add gridlines �@�@�@(4) Delete the points(markers) in the correspondence table from the graph. �@�@�@�@�@�@�@ Left-click the graph area to activate it. �@�@�@�@�@�@�A Left-click �mIncert�n���mScatter plot�n���mSmooth line�n �@�@�@�@�@�@ 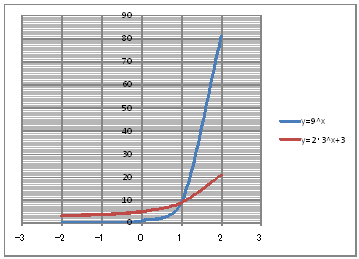 �@�@�@��Consideration�� �@�@�@�@�@�@Solve the inequality 9^x�@<�@2�3^x�@+�@3 from the intersection of the graphs of y=9^x and y=2�3^x+3. �@ |
| �@�y�R�O�V�z Compare the size of 8^(1/4) , 16^(1/3) , 64^(1/5) using a graph. | ||||||||||||
| �@��Procedure�� �@�@�@�@�@�@�@�@ �@�@�@(1) Create the following correspondence table on a worksheet.
�@�@�@��Reference�� �@�@�@�@�@�sHow to complete the worksheet above�t�@�@�@�@�@�@�@ �@�@�@�@�@�@�@Enter the information in cells B12 , B13 , and B14 as shown in the worksheet above. �@�@�@�@�@�@�@Enter =POWER(8,1/4) in Cell C12. �@�@�@�@�@�@�@Enter =POWER(16,1/3) in Cell C13. �@�@�@�@�@�@�@Enter =POWER(64,1/5) in Cell C14 �@�@�@(2) Draw a graph from the correspondence table in (1) above. �@�@�@�@�@�@�@ Drag and select the cell range B12:C14 in the correspondence table of (1) above. �@�@�@�@�@�@�A Left-click �mInsert�n���mVertical bar�n���m2-D vertical bar cluster�n �@�@�@�@�@�@ 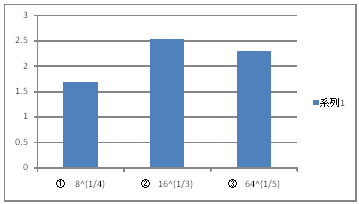 �@�@�@��Consideration�� �@�@�@�@�@�@Compare the sizes of 8^(1/4)�@16^(1/3)�@64^(1/5) from the bar graphs of 8^(1/4) , 16^(1/3) , and 64^(1/5) �@�@�@�@�@�@ |
| �@To table of contents�@ |
| �@�y�S�O�P�z Draw a graph of the logarithmic functions of y=log(2)x , y=log(3)x , y=log(4)x | |||||||||||||||||||||||||||||||||||||||||||||||||||||||
| �@��Procedure�� �@�@�@(1) Create the following correspondence table on the worksheet.
�@�@�@��Reference�� �@�@�@�@�@�sHow to complete the worksheet above�t �@�@�@�@�@�@�@Drag the cell range B12:B20 and right-click , and select Cell formatting. �@�@�@�@�@�@�@Select a number from the classification and set the number of decimal places to 5. �@�@�@�@�@�@�@Enter 1/16 in half-width in cell B12 (Displayed as a decimal). �@�@�@�@�@�@�@Enter data in the cell range B13:B20 using half-width characters as shown in the worksheet above. �@�@�@�@�@�@�@Enter =LOG(B12,2) in half-width in cell C12. �@�@�@�@�@�@�@Enter =LOG(B12,3) in half-width in cell D12. �@�@�@�@�@�@�@Enter =LOG(B12,4) in half-width in cell E12. �@�@�@�@�@�@�@Drag the cell range C12:E12 , right-click , and select Copy. �@�@�@�@�@�@�@Drag the cell range C13:C20 , right-click , and select Paste. �@�@�@(2) Draw a graph from the correspondence table in (1) above. �@�@�@�@�@�@�@ Drag and select the cell range B11:E20 in the correspondence table of (1) above. �@�@�@�@�@�@�A Left-click �mIncert�n���mScatter plot�n���mSmooth line and Marker�n �@�@�@�@�@�@�B Expand the graph area vertically by dragging the top and bottom edges of the graph area. �@�@�@(3) Arrange the xy coordinate plane on which the graph is drawn. �@�@�@�@�@�@�@ Right-click on the numbers on the x-axis �� Add gridlines �@�@�@�@�@�@�A Right-click on the numbers on the x-axis �� Axis formatting �� Auxiliary scale interval Fixed 1.0 �@�@�@�@�@�@�� close �� Right-click on the numbers on the x-axis �� Add auxiliary gridlines �@�@�@�@�@�@�B Right-click on the numbers on the y-axis �� Axis formatting �� Auxiliary scale interval Fixed 0.5 �@�@�@�@�@�@�� close �� Right-click on the numbers on the y-axis �� Add auxiliary gridlines �@�@�@(4) Delete points(markers) in the correspondence table from the graph. �@�@�@�@�@�@�@ Left-click on the graph area to activate it. �@�@�@�@�@�@�A Left-click �mIncert�n���mScatter plot�n���mSmooth line�n �@�@�@�@�@�@ 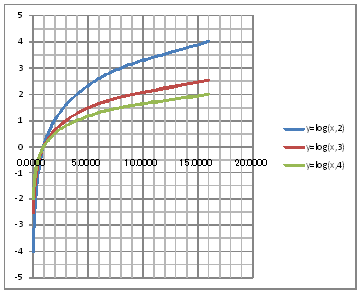 �@�@�@��Consideration 1�� �@�@�@�@�@�@Find the coordinates of point which the graphs of y=log(2)x , y=log(3)x , and y=log(4)x commonly pass through. �@�@�@��Consideration 2�� �@�@�@�@�@�@Find the common asymptote for the graphs of y=log(2)x , y=log(3)x , and y=log(4)x. �@�@�@��Consideration 3�� �@�@�@�@�@�@State the difference between the graphs of y=log(2)x , y=log(3)x , and y=log(4)x. �@ |
| �@�y�S�O�Q�z Draw a graph of the logarithmic functions of y=log(1/2)x , y=log(1/3)x , and y=log(1/4)x. | |||||||||||||||||||||||||||||||||||||||||||||||||||||||
| �@��Procedure�� �@�@�@(1) Create the following correspondence table on a worksheet. �@�@�@��Reference�� �@�@�@�@�@�@Refer to �y�S�O�P�z how to complete the wprksheet.
�@�@�@(2) Draw a graph from the correspondence table in (1) avobe. �@�@�@�@�@�@�@ Drag and select the cell range B11:E20 in the correspondence table of (1) above. �@�@�@�@�@�@�A Left-click �mIncert�n���mScatter plot�n���mSmooth line and Marker�n �@�@�@�@�@�@�B Expand the graph area vertically by dragging the top and bottom of graph area. �@�@�@(3) Arrange the xy coordinate plane on which the graph is drawn. �@�@�@�@�@�@�@ Right-click on the numbers on the x-axis �� Add gridlines �@�@�@�@�@�@�A Right-click on the numbers on the x-axis �� Axis formatting �� Auxiliary scale interval Fixed 1.0 �@�@�@�@�@�@�� close �� Right-click on the numbers on the x-axis �� Add auxiliary gridlines �@�@�@�@�@�@�B Right-click on the numbers on the y-axis �� Axis formatting �� Auxiliary scale interval Fixed 0.5 �@�@�@�@�@�@�� close �� Right-click on the numbers on the y-axis �� Add auxiliary gridlines �@�@�@(4) Delete points (markers) in the correspondence table from the graph. �@�@�@�@�@�@�@ Left-click on the graph area to activate it. �@�@�@�@�@�@�A Left-click �mIncert�n���mScatter plot�n���mSmooth line�n �@�@�@�@�@�@ 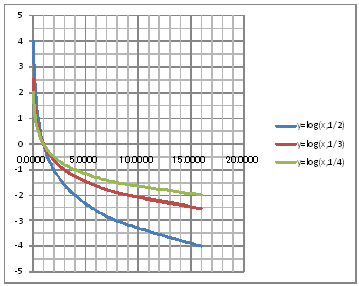 �@�@�@��Consideration 1�� �@�@�@�@�@�@Find the coordinates of the point that the graphs of y=log(1/2)x , y=log(1/3)x and , y=log(1/4)x pass commonly through. �@�@�@��Consideration 2�� �@�@�@�@�@�@Find the common asymptote for the graphs of y=log(1/2)x , y=log(1/3)x and , y=log(1/4)x. �@�@�@��Consideration 3�� �@�@�@�@�@�@State the difference between the graphs of y=log(1/2)x , y=log(1/3)x and , y=log(1/4)x. |
| �@�y�S�O�R�z Draw a graph of the logarithmic functions of y=log(2)x and y=log(1/2)x. | ||||||||||||||||||||||||||||||||||||||||||||
| �@��Procedure�� �@�@�@(1) Create the following corresspondence table on the worksheet. �@�@�@��Referrence�� �@�@�@�@�@�@Please refer to �y�S�O�P�z how to complete the worksheet.
�@�@�@(2) Draw a graph from the correspondence table in (1) above. �@�@�@�@�@�@�@ Drag and select the cell range B11:D20 in the correspondence table of (1) above. �@�@�@�@�@�@�A Left-click �mInsert�n���mScatter plot�n���mSmooth line and Marker�n �@�@�@�@�@�@�B Expand the graph area vertically by dragging the top and bottom edges of the graph area. �@�@�@(3) Arrange the xy coordinate plane on which the graph is drawn. �@�@�@�@�@�@�@ Right-click on the numbers on the x-axis �� Add gridlines �@�@�@�@�@�@�A Right-click on the numbers on the x-axis �� Axis formatting �� Auxiliary scale interval Fixed 1.0 �@�@�@�@�@�@�� close �� Right-click on the numbers on the x-axis �� Add auxiliary gridlines �@�@�@�@�@�@�B Right-click on the numbers on the y-axis �� Axis formatting �� Auxiliary scale interval Fixed 0.5 �@�@�@�@�@�@�� close �� Right-click on the numbers on the y-axis �� Add auxiliary gridlines �@�@�@(4) Delete points (markers) in the correspondence table from the graph. �@�@�@�@�@�@�@ Left-click on the graph area to activate it. �@�@�@�@�@�@�A Left-click �mIncert�n���mScatter plot�n���mSmooth line�n �@�@�@�@�@�@ 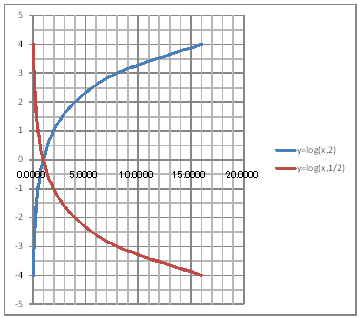 �@�@�@��Consideration 1�� �@�@�@�@�@�@�@State the positional relationship of the graphs of y=log(2)x and y=log(1/2)x. �@�@�@��Consideration 2�� �@�@�@�@�@�@�@In general , what can be said about the positional relationship between the graphs of y=log(2)x and y=log(1/2)x. |
| �@�y�S�O�S�z Draw a graph of the logarithmic functions of y=log(2)x and y=log(2)(1/x) | ||||||||||||||||||||||||||||||||||||||||||||
| �@��Procedure�� �@�@�@(1) Create the following correspondence table on the worksheet. �@�@�@��Reference�� �@�@�@�@�@�@Please refer to �y�S�O�P�z how to complete the worksheet.
�@�@�@(2) Draw a graph from the correspondence table in (1) above. �@�@�@�@�@�@�@ Drag and select the cell range B11:D20 in the correspndence table of (1) above. �@�@�@�@�@�@�A Left-click �mIncert�n���mScatter plot�n���mSmooth line and Markers�n �@�@�@�@�@�@�B Expand the graph area vertically by dragging the top and bottom of the graph area. �@�@�@(3) Arrange the xy coordinate plane on which the graph is drawn. �@�@�@�@�@�@�@ Right-click on the numbers on the x-axis �� Add gridlines �@�@�@�@�@�@�A Right-click on the numbers on the x-axis �� Axis formatting �� Auxiliary scale interval Fixed 1.0 �@�@�@�@�@�@�� close �� Right-click on the numbers on the x-axis �� Add auxiliary gridlines �@�@�@�@�@�@�B Right-click on the numbers on the y-axis �� Axis formatting �� Auxiliary scale interval Fixed 0.5 �@�@�@�@�@�@�� close �� Right-click on the numbers on the y-axis �� Add auxiliary gridlines �@�@�@(4) Delete points (markers) in the correspondence table from the graph. �@�@�@�@�@�@�@ Left-click on the graph area to activate it. �@�@�@�@�@�@�A Left-click �mIncert�n���mScatter plot�n���mSmooth line�n �@�@�@�@�@�@ 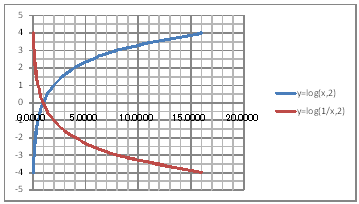 �@�@�@��Consideration 1�� �@�@�@�@�@�@�@State the positional relationship between the graphs of y=log(2)x and y=log(2)(1/x). �@�@�@��Consideration 2�� �@�@�@�@�@�@In general , what can be said about the positional relationship between the graphs of y=log(a)x and y=log(a)(1/x). �@ |
| �@�y�S�O�T�z Solve equation log(10)x+log(10)(x-3)=1 using graphs. | ||||||||||||||||||||||||||||||||||||||||||||
| �@��Procedure�� �@�@�@�@�@�@�@�@�@�@ �@�@�@�@�@�@�@�@�@�@Draw graphs of y=log(10)x and y=-log(10)(x-3)+1. �@�@�@(1) Create the following correspondence table on the worksheet. �@�@�@��Reference�� �@�@�@�@�@�@Please refer to �y401�z how to complete the worksheet.
�@�@�@(2) Draw a graph from the correspondence table in (1) above. �@�@�@�@�@�@�@ Drag and select the cell range B11:D20 in the correpondence table of (1) above. �@�@�@�@�@�@�A Left-click �mIncert�n���mScatter plot�n���mSmooth line and marker�n �@�@�@�@�@�@�B Expand the graph area vertically by dragging the top and bottom edges of the graph area. �@�@�@(3) Arrange the xy coordinate plane on which the graph is drawn. �@�@�@�@�@�@�@ Right-click on the numbers on the x-axis �� Axis formatting �� Scale interval Fixed 1.0 �@�@�@�@�@�@�� close �� Right-click on the numbers on the x-axis �� Add gridlines �@�@�@�@�@�@�A Right-click on the numbers on the y-axis �� Axis formatting �� Auxiliary scale interval Fixed 0.1 �@�@�@�@�@�@�� close �� Right-click on the numbers on the y-axis �� Add auxiliary gridlines �@�@�@(4) Delete points (markers) in the correspondence table from the graph. �@�@�@�@�@�@�@ Left-click on the graph area to activate it �@�@�@�@�@�@�A Left-click �mIncert�n���mScatter plot�n���mSmooth line�n �@�@�@�@�@�@ 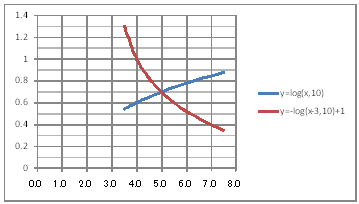 �@�@�@��Consideration�� �@�@�@�@�@�@�@Solve equation log(10)x+log(10)(x-3)=1 from the intersection of the graphs of y=log(10)x and y=-log(10)(x-3)+1. |
| �@�y�S�O�U�z Solve inequality log(3)(x-3)+log(3)(x-5)<1 using a graph. | ||||||||||||||||||||||||||||||||||||
| �@��Procedure�� �@�@�@�@�@�@�@�@�@�@log(3)(x-3) < -log(x-5)+1 �@�@�@�@�@�@�@�@�@�@Draw graphs of y=log(3)(x-3) and y=-log(3)(x-5)+1. �@�@�@(1) Create the following correspondence table on a worksheet. �@�@�@��Reference�� �@�@�@�@�@Please refer to �y401�z how to complete the worksheet.
�@�@�@(2) Draw a graph from the correspondence table in (1) above. �@�@�@�@�@�@�@ Drag and select the cell range B11:D18 in the correspondence table of (1) above. �@�@�@�@�@�@�A Left-click �mIncert�n���mScatter plot�n���mSmooth line and Marker�n �@�@�@�@�@�@�B Expand the graph area vertically by dragging the top and bottom edges of the graph area. �@�@�@(3) Arrange the xy coordinate plane on which the graph is drawn. �@�@�@�@�@�@�@ Right-click on the numbers on the x-axis �� Axis formatting �� Scale interval Fixed 1.00 �@�@�@�@�@�@�� close �� Right-click on the numbers on the x-axis �� Add gridline �@�@�@�@�@�@�A Right-click on the numbers on the y-axis �� Axis formatting �� Auxiliary scale interval Fixed 0.1 �@�@�@�@�@�@�� close �� Right-click on the numbers on the y-axis �� Add auxiliary gridline �@�@�@(4) Delete points (markers) in the correspondence table from the graph. �@�@�@�@�@�@�@ Left-click on the graph area to activate it. �@�@�@�@�@�@�A Left-click �mIncert�n���mScatter plot�n���mSmooth line�n �@�@�@�@�@�@ 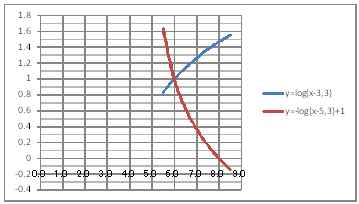 �@�@�@��Consideration�� �@�@�@�@�@�@�@Solve inequality log(3)(x-3)+log(3)(x-5) < 1 from the intersection of the graphs of y=log(3)(x-3) and y=-log(3)(x-5)+1 �@�@�@�@�@�@ |
| �@�y�S�O�V�z Compare the size of 1/2, -log(2)(1/3) , and log(1/2)7 using the graphs. | ||||||||||||
| �@��Procedure�� �@�@�@(1) Create the following correspondence table on a worksheet.
�@�@�@��Reference�� �@�@�@�@�@�sHow to complete a worksheet above�t �@�@�@�@�@�@�@Enter data into cells B12 , B13 , and B14 as shown in the worksheet above. �@�@�@�@�@�@�@Drag the cell range C12:C14 , right-click , and select Cell Formatting. �@�@�@�@�@ �@ Select a number from the crassification and set the number of decimal places to 5. �@�@�@�@�@�@�@Enter 1/2 in half-width in cell C12. �@�@�@�@�@�@�@Enter =-1*LOG(1/3,2) in half-width in cell C13. �@�@�@�@�@�@�@Enter =LOG(7,1/2) in half-width in cell C14. �@�@�@(2) Draw a graph from the correspondence table in (1) above. �@�@�@�@�@�@�@ Drag and select the cell range B12:C14 in the correspondence table of (1) above. �@�@�@�@�@�@�A Left-click �mIncert�n���mVertical bar�n���m2-D vertical bar cluster�n �@�@�@�@�@�@ 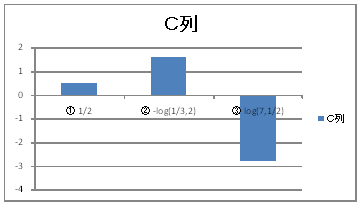 �@�@�@��Consideration�� �@�@�@�@�@�@From the bar graphs of 1/2 , -log(2)(1/3) , and log(1/2)7 , compare the sizes of 1/2 , -log(2)(1/2) , and log(1/2)7. |
| �@To table of contents�@ |
| �@�y�T�O�P�z Draw a circle x^2+y^2+6x-8y-11=0 | ||||||||||||||||||||||||||||||||||||||||||||
| �@��Procedure���@ �@�@�@�@�@�@�@�@�@�@x^2+y^2+6x-8y-11=0 �@�@�@�@�@�@�@�@�@�@x^2+6x+9+y^2-8y+16=11+9+16 �@�@�@�@�@�@�@�@�@�@(x+3)^2+(y-4)^2=36 , center(-3,4 ) , radius 6 �@�@�@�@�@�@�@�@�@�@(y-4)^2=36-(x+3)^2 �@�@�@�@�@�@�@�@�@�@y-4=+��{36-(x+3)^2} , -��{36-(x+3)^2} �@�@�@�@�@�@�@�@�@�@y=4+��{36-(x+3)^2} , 4-��{36-(x+3)^2} �@�@�@(1) Create the following correspondence table on a worksheet.
�@�@�@��Reference�� �@�@�@�@�@�sHow to complete the worksheet above�t �@�@�@�@�@�@�@Enter -9 in half-width in cell B12. �@�@�@�@�@�@�@Enter =B12+0.1 in half-width in cell B13. �@�@�@�@�@�@�@Right-click on cell B13 and select Copy. �@�@�@�@�@�@�@Drag the cell range B14:B132 , Right-click , and select Paste. �@�@�@�@�@�@�@Enter =4+SQRT(36-(B12+3)^2) in half-width in cell C12. �@�@�@�@�@�@�@Enter =4-SQRT(36-(B12+3)^2) in half-width in cell D12. �@�@�@�@�@�@�@Drag the cell range C12:D12 , Right-click , and select Copy. �@�@�@�@�@�@�@Drag the cell range C13:C132 , Right-click , and select Paste. �@�@�@(2) Draw a graph from the correspondence table in (1) above. �@�@�@�@�@�@�@ Drag and select the cell range B11:D132 in the correspondence table of (1) above. �@�@�@�@�@�@�A �mIncert�n���mScatter plot�n���mSmooth line�n �@�@�@�@�@�@�B Drag the top and bottom edges of the graph area to stretch and adjust. �@�@�@(3) Arrange the xy plane on which the graph is drawn. �@�@�@�@�@�@�@ Right-click on the numbers on the x-axis �� Axis formatting �� Auxiliary scale interval Fixed 1.0 �@�@�@�@�@�@�� close �� Right-click on the numbers on the x-axis �� Add auxiliary gridlines �@�@�@�@�@�@�A Right-click on the numbers on the y-axis �� Axis formatting �� Auxiliary scale interval Fixed 1.0 �@�@�@�@�@�@�� close ��Right-click on the numbers on the y-axis �� Add auxiliary gridlines �@�@�@�@�@�@ 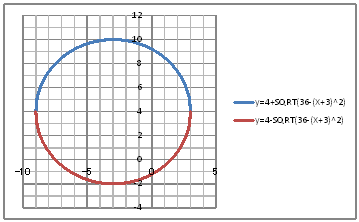 �@�@�@��Consideration�� �@�@�@�@�@�@�@Make sure that it is a circle with center(-3,4) and radius 6. �@ |
| �y�T�O�Q�z Find the coordinates of the common point between circle x^2+y^2=5 and straight line y=-x+1 by drawing a graph. | |||||||||||||||||||||||||||||||||||||||||||||||||||||||
| �@��Procedure�� �@�@�@�@�@�@�@�@�@�@ �@�@�@�@�@�@�@�@�@�@ �@�@�@(1) Create the following correspondence table on a worksheet.
�@�@�@��Reference�� �@�@�@�@�@�sHow to complete the worksheet above�t �@�@�@�@�@�@�@Enter -2.236 in half-width in cell B12. �@�@�@�@�@�@�@Enter -2.2 in half-width in cell B13. �@�@�@�@�@�@�@Enter =B13+0.1 in half-width in cell B14. �@�@�@�@�@�@�@Right-click on cell B14 and select Copy. �@�@�@�@�@�@�@Drag the cell range B15:B57 , right-click , and select Paste. �@�@�@�@�@�@�@Enter 2.236 in half-width in cell C12. �@�@�@�@�@�@�@Enter =SQRT(5-B12^2) in half-width in cell C12. �@�@�@�@�@�@�@Enter =-SQRT(5-B12^2) in half-width in cell D12. �@�@�@�@�@�@�@Enter =-B12+1 in half-width in cell E12. �@�@�@�@�@�@�@Drag the cell range C12:E12 , right-click , and select Copy. �@�@�@�@�@�@�@Drag the cell range C13:C58 , right-click , and select Paste. �@�@�@(2) Draw a graph from the correspondence table in (1) above. �@�@�@�@�@�@�@ Drag and select the cell range B11:E58 in the correspondence table of (1) above. �@�@�@�@�@�@�A Left-click �mIncert�n���mScatter plot�n���mSmooth line�n �@�@�@�@�@�@�B Drag the top and bottom edges of the graph area to stretch and adjust. �@�@�@(3) Arrange the xy coordinate plane on which the graph is drawn. �@�@�@�@�@�@�@ Right-click on the numbers on the x-axis �� Add gridlines �@�@�@�@�@�@ 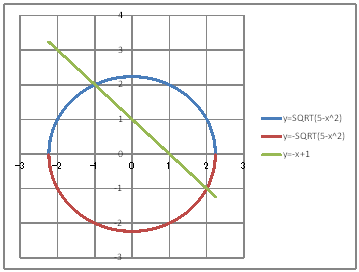 �@�@�@��Consideration�� �@�@�@�@�@�@Find the coordinates of the common point from the graphs circle x^2+y^2=5 and straight line y=-x+1. �@ |
| �y�T�O�R�z Draw an ellipse whose sum of distances from two fixed points (3,0) and (-3,0) is 10. | ||||||||||||||||||||||||||||||||||||||||||||
| �@��Procedure�� �@�@�@�@�@�@�@�@�@�@Let x^2/a^2+y^2/b^2=1 be the ellipse to seek. �@�@�@�@�@�@�@�@�@�@�����R �@�@�@�@�@�@�@�@�@�@Since �Q�����P�O , �����T �@�@�@�@�@�@�@�@�@�@Since c=��(a^2-b^2) , 3=��(5^2-b^2) �@�@�@�@�@�@�@�@�@�@�����S �@�@�@�@�@�@�@�@�@�@Therefore , �@�@�@�@�@�@�@�@�@�@�@�@x^2/5^2 + y^2/4^2 = 1 , y=4��(1 - x^2/25) , y=-4��(1 - x^2/25) �@�@�@(1) Create the following correspondence table in a worksheet.
�@�@�@��Reference�� �@�@�@�@�@�sHow to complete the worksheet above�t �@�@�@�@�@�@�@Enter -5 in half-width in cell B12. �@�@�@�@�@�@�@Enter =B12+0.1 in half-width in cell B13. �@�@�@�@�@�@�@Right-click on cell B13 and select Copy. �@�@�@�@�@�@�@Drag the cell range B14:B112 , right-click , and select Paste. �@�@�@�@�@�@�@Enter =4*SQRT(1-B12^2/25) in half-width in cell C12. �@�@�@�@�@�@�@Enter =-4*SQRT(1-B12^2/25) in half-width in cell D12. �@�@�@�@�@�@�@Drag the cell range C12:D12 , right-click , and select Copy. �@�@�@�@�@�@�@Drag the cell range C13:C112 , right-click , and select Paste. �@�@�@(2) Drag a graph from the correspondence table in (1) above. �@�@�@�@�@�@�@ Drag and select the cell range B11:D112 in the correspondence table of (1) above. �@�@�@�@�@�@�A Left-click �mIncert�n���mScatter plot�n���mSmooth line�n �@�@�@�@�@�@�B Drag the right and left edges of the graph areas holizontally to stretch and adjust. �@�@�@(3) Arrange the xy coordinate plane on which the graph is drawn. �@�@�@�@�@�@�@ Right-click on the numbers on the x-axis �� Axis formatting �� Scale interval Fixed 1.0 �@�@�@�@�@�@�� close �� Right-click on the numbers on the x-axis �� Add gridlines �@�@�@�@�@�@ 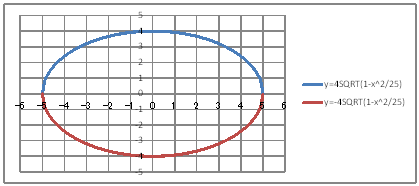 �@�@�@��Consideration�� �@�@�@�@�@�@�@Make sure that ellipse x^2/5^2 + y^2/4^2 = 1 is drawn. |
| �y�T�O�S�z Draw a parabola whose distance from rhe fixed point (2,0) is equal to the distance from the straight line x=-2. | ||||||||||||||||||||||||||||||||||||||||||||
| �@��Procedure�� �@�@�@�@�@�@�@�@�@�@Let y^2=4px be the parabola to seek. �@�@�@�@�@�@�@�@�@�@Since p=2 , y^2=8x �@�@�@�@�@�@�@�@�@�@y=2��(2x) , y=-2��(2x) �@�@�@(1) Create the following correspondence table on a worksheet.
�@�@�@��Reference�� �@�@�@�@�@�sHow to complete the worksheet above�t �@�@�@�@�@�@�@Enter 0 in half-width in cell B12. �@�@�@�@�@�@�@Enter =B12+0.1 in half-width in cell B12. �@�@�@�@�@�@�@Right-click on cell B13 and select Copy. �@�@�@�@�@�@�@Drag the cell range B14:B52 , right-click , and select Paste. �@�@�@�@�@�@�@Enter =2*SQRT(2*B12) in half-width in cell C12. �@�@�@�@�@�@�@Enter =-2*SQRT(2*B12) in half-width in cell D12. �@�@�@�@�@�@�@Drag the cell range C12:D12 , right-click , and select Copy. �@�@�@�@�@�@�@Drag the cell range C13:C52 , right-click , and select Paste. �@�@�@(2) Draw a graph from the correspondence table in (1) above. �@�@�@�@�@�@�@ Drag and select the cell range B11:D52 in the correspondence table of (1) above. �@�@�@�@�@�@�A Left-click �mIncert�n���mScatter plot�n���mSmooth line�n �@�@�@�@�@�@�B Drag the top and bottom edges of graph area vertically to stretch and adjust. �@�@�@(3) Arrange the coordinate plane on which the graph is drawn. �@�@�@�@�@�@�@ Right-click on the numbers on the x-axis �� Add gridlines �@�@�@�@�@�@ 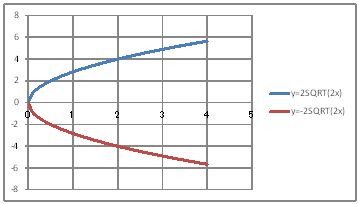 �@�@�@��Consideration�� �@�@�@�@�@�@�@Make sure that parabola y^2=8x is drawn. |
| �@�y�T�O�T�z Draw a hyperbola whose dtfference between distances from two fixed points (5,0) and (-5,0) is 6. | ||||||||||||||||||||||||||||||||||||||||||||||||||||||||||||||||||||
| �@��Procedure�� �@�@�@�@�@�@�@�@�@�@Let x^2/a^2 - y^2/b^2 = 1 be the hyperbola to seek. �@�@�@�@�@�@�@�@�@�@Since c=5 , 2a=6 , c=��(a^2+b^2) , a=3 , b=4 �@�@�@�@�@�@�@�@�@�@Therefore �@�@�@�@�@�@�@�@�@�@�@�@�@x^2/3^2 - y^2/4^2 = 1 , y=4��(x^2/9 - 1) , y=-4��(x^2/9 - 1) �@�@�@(1) Create the following correspondence table in a worksheet.
�@�@�@��Reference�� �@�@�@�@�@�sHow to complete the worksheet above�t �@�@�@�@�@�@�@Enter 10 in half-width in cell B12. �@�@�@�@�@�@�@Enter =B12-0.1 in half-width in cell B13. �@�@�@�@�@�@�@Right-click on cell B13 and select Copy. �@�@�@�@�@�@�@Drag the cell range B14:B82 , right-click , and select Paste. �@�@�@�@�@�@�@Enter -3 in half-width in cell B84. �@�@�@�@�@�@�@Enter =B84-0.1 in half-width in cell B85. �@�@�@�@�@�@�@Right-click on cell B85 and select Copy. �@�@�@�@�@�@�@Drag the cell range B86:B154 , right-click , and select Paste. �@�@�@�@�@�@�@Enter =4*SQRT(B12^2/9-1) in half-width in cell C12. �@�@�@�@�@�@�@Enter =-4*SQRT(B12^2/9-1) in half-width in cell D12 �@�@�@�@�@�@�@Drag the cell range C12:D12 , right-click , and select Copy. �@�@�@�@�@�@�@Drag the cell range C13:C154 , right-click , and select Paste. �@�@�@(2) Draw a graph from the correspondence table in (1) above. �@�@�@�@�@�@�@See �y504�z �@�@�@(3) Arrange the xy coordinate plane on whic the graph is drawn. �@�@�@�@�@�@�@ Right-click on the numbers on x-axis �� Axis formatting �� Auxiliary scale interval Fixed 1.0 �@�@�@�@�@�@�� close �� Right-click on the numbers on x-axis �� Add auxiliary gridlines �@�@�@�@�@�@�A Right-click on the numbers on y-axis �� Axis formatting �� Auxiliary scale interval Fixed 1.0 �@�@�@�@�@�@�� close �� Right-click on the numbers on y-axis �� Add auxiliary gridlines �@�@�@�@�@�@ 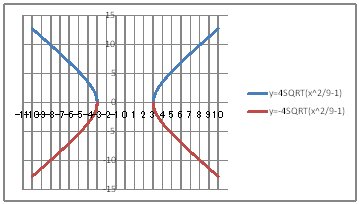 �@�@�@��Consideration�� �@�@�@�@�@�@�@Make sure that hyperbola x^2/3^2 - y^2/4^2 = 1 is drawn. |
| �@To table of contents�@ |
| �@�y�U�O�P�z Draw graphs of function y=-2x^3+6x+1 and y'=-6x^2+6. | ||||||||||||||||||||||||||||||||||||||||||||
| �@��Procedure�� �@�@�@(1) Create the following correspondence table on a worksheet.
�@�@�@��Reference�� �@�@�@�@�@�sHow to complete the worksheet above.�t �@�@�@�@�@�@�@Enter -3 in half-width in cell B12. �@�@�@�@�@�@�@Enter =B12+0.1 in half-width in cell B13. �@�@�@�@�@�@�@Right-click on cell B13 and select Copy. �@�@�@�@�@�@�@Drag the cell range B14:B72 , right-click and , select Paste. �@�@�@�@�@�@�@Enter =-2*B12^3+6*B12+1 in half-width in cell C12. �@�@�@�@�@�@�@Enter =-6*B12^2+6 in half-width in cell D12. �@�@�@�@�@�@�@Drag the cell range C12:D12 , right-click , and select Copy. �@�@�@�@�@�@�@Drag the cell range C13:C72 , right-click , and select Paste. �@�@�@(2) Draw a graph from the correspondence table in (1) above. �@�@�@�@�@�@�@ Drag and select the cell range B11:D72 in the correspondence table of (1) above. �@�@�@�@�@�@�A Left-click �mIncert�n���mScatter plot�n���mSmooth line�n. �@�@�@�@�@�@�B Drag the top and bottom area of the graph area vertically to strech and adjust. �@�@�@(3) Arrange the xy coordinate plane on which the graph is drawn. �@�@�@�@�@�@�@ Right-click on the numbers on the x-axis �� Axis formatting �� Scale interval Fixed 1.0 �@�@�@�@�@�@�� close �� Right-click on the numbers on the x-axis �� Add gridlines �@�@�@�@�@�@ 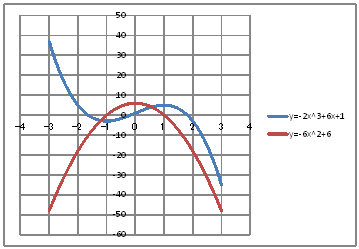 �@�@�@��Consideration 1�� �@�@�@�@�@�@�@When y'<0 , what does the graph of y=-2x^2+6x+1 look like ? �@�@�@��Consideration 2�� �@�@�@�@�@�@�@When y'>0 , what does the graph of y=-2x^2+6x+1 look like ? �@�@�@��Consideration 3�� �@�@�@�@�@�@�@When y'=0 , what does the graph of y=-2x^2+6x+1 look like ? �@ |
| �y�U�O�Q�z Find the maximam and minimum values by drawing a graph of function y=2x^3-3x^2-12x-6 (-2��x��4) | |||||||||||||||||||||||||||||||||
| �@��Procedure�� �@�@�@(1) Create the following correspondence table on a worksheet.
�@�@�@��Reference�� �@�@�@�@�@�sHow to complete the worksheet above�t �@�@�@�@�@�@�@Enter -2 in half-width in cell B12. �@�@�@�@�@�@�@Enter =B12+0.1 in half-width in cell B13. �@�@�@�@�@�@�@Right-click on cell B13 and select Copy. �@�@�@�@�@�@�@Drag the cell range B14:B72 , right-click , and select Paste. �@�@�@�@�@�@�@Enter =2*B12^3-3*B12^2-12*B12-6 in half-width in cell C12. �@�@�@�@�@�@�@Right-click on cell C12 and select Copy. �@�@�@�@�@�@�@Drag the cell range C13:C72 , right-click , and select Paste. �@�@�@(2) Draw a graph from the correspondence table in (1) above. �@�@�@�@�@�@�@ Drag and select the cell range B11:C72 in the orrespondence table of (1) above. �@�@�@�@�@�@�A Left-click �mIncert�n���mScatter plot�n���mSmooth line�n �@�@�@�@�@�@�B Drag the top and bottom edges of the graph area vertically to stretch and adjust. �@�@�@(3) Arrange the xy coordinate plane on which the graph is drawn. �@�@�@�@�@�@�@ Right-click on the numbers on the x-axis �� Axis formatting �� Scale interval Fixed 1.0 �@�@�@�@�@�@�� close �� Right-click on the numbers on the x-axis �� Add gridlines �@�@�@�@�@�@�A Right-click on the numbers on the y-axis �� Axis formatting �� Auxiliary scale interval Fixed 1.0 �@�@�@�@�@�@�� close �� Right-click on the numbers on the y-axis �� Add auxiliary gridlines �@�@�@�@�@�@�B Right-click on the numbers on the y-axis �� Axis formatting �� Scale interval Fixed 5.0 �@�@�@�@�@�@�� close �@�@�@�@�@�@ 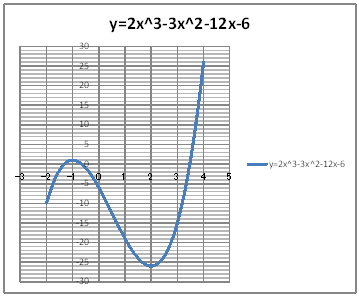 �@�@�@��Consideration 1�� �@�@�@�@�@�@�@ Find the maximum value when -2��x��4 from the graph. �@�@�@��Consideration 2�� �@�@�@�@�@�@�@Find the minimum value when -2��x��4 from the graph. �@ |
| �y�U�O�R�z Find the number of different real solutions for cubic equation x^3-3x^2-a=0 using a graph. | ||||||||||||||||||||||||||||||||||||||||||||||||||||||||
| �@��Procedure�� �@�@�@�@�@�@�@�@�@�@x^3-3x^2=a �@�@�@�@�@�@�@�@�@�@Draw graphs of y=x^3-3x^2 and y=a. �@�@�@(1) Create the following correspondence table on a worksheet.
�@�@�@��Reference�� �@�@�@�@�@�sHow to complete the worksheet above�t �@�@�@�@�@�@�@Enter a= in cell B81. �@�@�@�@�@�@�@Enter 1 in half-width in cell C81. �@�@�@�@�@�@�@Enter -2 in half-width in cell B12 �@�@�@�@�@�@�@Enter =B12+0.1 in half-width in cell B13. �@�@�@�@�@�@�@Right-click on cell B13 and select Copy. �@�@�@�@�@�@�@Drag the cellrange B14:B72 , right-click , and select Paste. �@�@�@�@�@�@�@Enter =B12^3-3*B12^2 in half-width in cell C12. �@�@�@�@�@�@�@Enter =$C$8 in half-width in cell D12. �@�@�@�@�@�@�@Drag the cellrange C12:D12 , right-click , and select Copy. �@�@�@�@�@�@�@Drag the cellrange C13:C72 , right-click , and select Paste. �@�@�@(2) Draw a graph from the correspondence table in (1) avove. �@�@�@�@�@�@�@ Drag and select the cell range B11:D72 in the correspondence table of (1) above. �@�@�@�@�@�@�A Left-click �mIncert�n���mScatter plot�n���mSmooth line�n �@�@�@�@�@�@�B Drag the top and bottom edges of the graph area vertically to stretch and adjust. �@�@�@(3) Arrange the xy coordinate plane on which the graph is drawn. �@�@�@�@�@�@�@ Right-click on the numbers on the x-axis �� Axis formatting �� Scale interval Fixed 1.0 �@�@�@�@�@�@�� close �� Right-click on the numbers on the x-axis �� Add gridlines �@�@�@�@�@�@�A Right-click on the numbers on the y-axis �� Axis formatting �� Auxiliary scale interval Fixed 1.0 �@�@�@�@�@�@�� close ��Right-click on the numbers on the y-axis �� Add auxiliary gridlines �@�@�@�@�@�@ 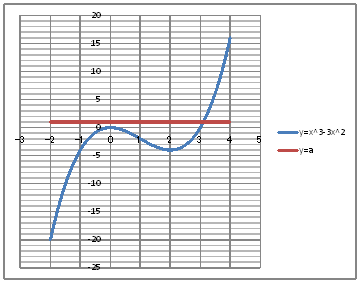 �@�@�@��Consideration 1�� �@�@�@�@�@�@�@When a=1 , a=-5 , find the number of different real solutions. �@�@�@��Consideration 2�� �@�@�@�@�@�@�@When a=0 , a=-4 , find the number of different real solutions. �@�@�@��Consideration 3�� �@�@�@�@�@�@�@When a=-2 , find the number of different real solutions. �@�@�@��Consideration 4�� �@�@�@�@�@�@�@How does the number of different real solutions change depending on the value of the constant a ? |
| �y�U�O�S�z When x��0 , draw a graph to confirm that the inequality x^3-3x^2+4��0. | |||||||||||||||||||||||||||||||||
| �@��Procedure�� �@�@�@(1) Create the following correspondence table on a worksheet.
�@�@�@��Reference�� �@�@�@�@�@�sHow to complete the worksheet above�t �@�@�@�@�@�@�@Enter 0 in half-width in cell B12. �@�@�@�@�@�@�@Enter =B12+0.1 in half-width in cell B13. �@�@�@�@�@�@�@Right-click on cell B13 and select Copy. �@�@�@�@�@�@�@Drag the cell range B14:B44 , right-click , and select Paste. �@�@�@�@�@�@�@Enter =B12^3-3*B12^2+4 in half-width in cell C12. �@�@�@�@�@�@�@Right-click on cell C12 and select Copy. �@�@�@�@�@�@�@Drag the cell range C13:C44 , right-click , and select Paste. �@�@�@(2) Draw a graph from the correspondence table in (1) above. �@�@�@�@�@�@�@ Drag and select the cell range B11:C44 in the correspondence table of (1) above. �@�@�@�@�@�@�A Left-click �mIncert�n���mScatter plot�n���mSmooth line�n �@�@�@�@�@�@�B Drag the top and bottom edges of the graph area vertically to stretch and adjust. �@�@�@(3) Arrange the xy coordinate plane on which the graph is drawn. �@�@�@�@�@�@�@ Right-click on the numbers on the x-axis �� Add gridlines �@�@�@�@�@�@ 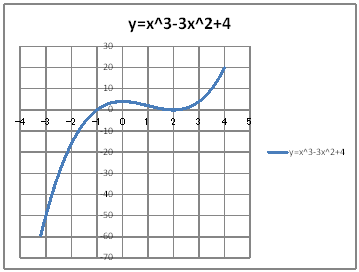 �@�@�@��Consideration�� �@�@�@�@�@�@�@When x��0 , �@�@�@�@�@�@�@look at the graph and confirm that the inequality x^3-3x^2+4��0 holds true. |
| �@�y�U�O�T�z Draw a graph of the curve y=logx and the tangent and normal at point(1,0) on it. | |||||||||||||||||||||||||||||||||||||||||||||||||||||||
| �@��Procedure�� �@�@�@�@�@�@�@�@�@�@ �@�@�@�@�@�@�@�@�@�@Tangent �F ���|�O���P�i���|�P�j�@�@�@�@���@�������|�P �@�@�@�@�@�@�@�@�@�@Normal �F ���|�O���|�P�i���|�P�j�@�@ ���@�����|���{�P �@�@�@(1) Create the following correspondence table on a worksheet.
�@�@�@��Reference�� �@�@�@�@�@�sHow to complete the worksheet above�t �@�@�@�@�@�@�@Enter 0.05 in half-width in cell B12. �@�@�@�@�@�@�@Enter =B12+0.05 in half-width in cell B13. �@�@�@�@�@�@�@Right-click on cell B13 and select Copy. �@�@�@�@�@�@�@Drag the cell range B14:B111 and right-click , and select Paste. �@�@�@�@�@�@�@Enter =LN(B12) in half-width in cell C12. �@�@�@�@�@�@�@Enter =B12-1 in half-width in cell D12. �@�@�@�@�@�@�@Enter =-B12+1 in half-width in cell E12. �@�@�@�@�@�@�@Drag the cell range C12:E12 and right-click , and select Copy. �@�@�@�@�@�@�@Drag the cell range C13:C111 and right-click , and select Paste. �@�@�@(2) Draw a graph from the correspondence table in (1) above. �@�@�@�@�@�@�@ Drag and select the cell range B11:E111 in the correspondence table of (1) above. �@�@�@�@�@�@�A Left-click �mIncert�n���mScatter plot�n���mSmooth line�n �@�@�@�@�@�@�B Arrange the top and bottom of the graph area vertically to stretch and adjust. �@�@�@(3) Arrange the xy coordinate plane on which the graph is drawn. �@�@�@�@�@�@�@ Right-click on the numbers on the x-axis �� Add gridlines �@�@�@�@�@�@ 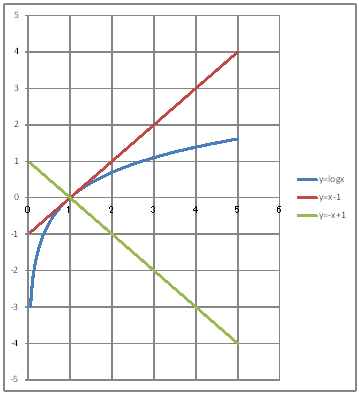 �@�@�@��Consideration 1�� �@�@�@�@�@�@�@Make sure that y=x-1 is tangent to point (1,0) on y=logx. �@�@�@��Consideration 2�� �@�@�@�@�@�@�@Make sure that y=-x+1 is normal to point (1,0) on y=logx. |
| �@�y�U�O�U�z Draw the graph of ellipse x^2/4 + y^2 = 1 and the tangent at the point (6/5,4/5) on it. | |||||||||||||||||||||||||||||||||||||||||||||||||||||||
| �@��Procedure�� �@�@�@�@�@�@�@�@�@�@Since y^2 = 1 - x^2/4 , y=�}��(1-x^2/4) �@�@�@�@�@�@�@�@�@�@Since the tangent formula , x/4 �~ 6/5 + y �~ 4/5 = 1 �@�@�@�@�@�@�@�@�@�@Therefore , tangent : y=-(3/8)x + 5/4 �@�@�@�@�@�@�@�@�@�@Draw the graphs of y = ��(1-x^2/4) , y = -��(1-x^2/4) , and y = -3/8 + 5/4 �@�@�@(1) Create the following correspondence table on a worksheet.
�@�@�@��Reference�� �@�@�@�@�@�sHow to complete the worksheet above�t �@�@�@�@�@�@�@Enter -2 in half-width in cell B12. �@�@�@�@�@�@�@Enter =B12+0.05 in half-width in cell B13. �@�@�@�@�@�@�@Right-click on cell B13 and select Copy. �@�@�@�@�@�@�@Drag the cell range B14:B32 , right-click , and select Paste. �@�@�@�@�@�@�@Enter =SQRT(1-B12^2/4) in half-width in cell C12. �@�@�@�@�@�@�@Enter =-SQRT(1-B12^2/4) in half-width in cell D12. �@�@�@�@�@�@�@Enter =-3*B12/8+5/4 in half-width in cell E12. �@�@�@�@�@�@�@Drag the cell range C12:E12 , right-click , and select Copy. �@�@�@�@�@�@�@Drag the cell range C13:C92 , right-click , and select Paste. �@�@�@(2) Draw a graph from the correspondence table in (1) above. �@�@�@�@�@�@�@ Drag and select the cell range B11:E92 in the correspondence table of (1) above. �@�@�@�@�@�@�A Left-click �mIncert�n���mScatter plot�n���mSmooth line] �@�@�@�@�@�@�B Drag the left and right edges of graph area horizontally and the top and bottom edges of graph area vertically to strech and adjust. �@�@�@(3) Arrange the xy coordinate plane on which the graph is drawn. �@�@�@�@�@�@�@ Right-click on the numbers on the x-axis �� Axis formatting �� Scale interval Fixed 1.0 �� close �@�@�@�@�@�@�� Right-click on the numbers on the x-axis �� Axis formatting �� Auxiliary scale interval Fixed 0.2�� close �@�@�@�@�@�@�� Right-click on the numbers on the x-axis �� Add auxiliary gridlines �@�@�@�@�@�@�A Right-click on the numbers on the y-axis �� Axis formatting �� Scale interval Fixed 1.0 �@�@�@�@�@�@�� close �� Right-click on the numbers on the y-axis �� Axis formatting �@�@�@�@�@�@�� Auxiliary scale interval Fixed 0.2 �� close �� Right-click on the numbers on the y-axis �@�@�@�@�@�@�� Add auxiliary gridlines �@�@�@�@�@�@ 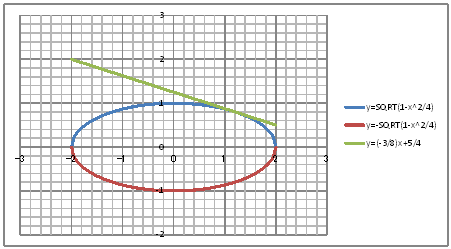 �@�@�@��Consideration�� �@�@�@�@�@�@Make sure that y=(-3/8)x+5/4 is the tangent to the point (6/5,4/5) on the ellipse x^2/4+y^2=1. |
| �@To table of contents�@ |
| �@�y�V�O�P�z Draw a graph of function y=x��(9-x^2). | |||||||||||||||||||||||||||||||||
| �@��Procedure�� �@�@�@(1) Create the following correspondence table on a worksheet.
�@�@�@��Reference�� �@�@�@�@�@�sHow to complete the worksheet above�t �@�@�@�@�@�@�@Enter -3 in half-width in the cell B12. �@�@�@�@�@�@�@Enter =B12+0.1 in half-width in the cell B13. �@�@�@�@�@�@�@Right-click on the cell B13 and select Copy. �@�@�@�@�@�@�@Drag the cell range B14:B72 , right-click , and select Paste. �@�@�@�@�@�@�@Enter =B12*SQRT(9-B12^2) in half-width in the cell C12. �@�@�@�@�@�@�@Right-click on the cell C12 and select Copy. �@�@�@�@�@�@�@Drag the cell range C13:C72 , right-click , and select Paste. �@�@�@(2) Draw a graph from the correspondence table in (1) above. �@�@�@�@�@�@�@ Drag and select the cell range B11:C72 in the correspondence table of (1) above. �@�@�@�@�@�@�A Left-click �mIncert�n���mScatter plot�n���mSmooth line�n �@�@�@�@�@�@�B Drag the top and bottom edges of the graph area vertically to stretch and adjust. �@�@�@(3) Arrange the xy coordinate plane on which the graph is drawn. �@�@�@�@�@�@�@ Right-click on the numbers on the x-axis �� Axis formatting �� Scale interval Fixed 1.0 �@�@�@�@�@�@�� close �� Right-click on the numbers on the x-axis �� Add gridlines �@�@�@�@�@�@�A Right-click on the numbers on the y-axis �� Axis formatting �� Auxiliary scale interval Fixed 0.5 �@�@�@�@�@�@�� close �� Right-click on the numbers on the y-axis �� Add auxiliary gridlines �@�@�@�@�@�@ 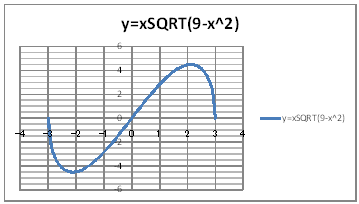 �@�@�@��Consideration 1�� �@�@�@�@�@�@�@Find the local maximum from the graph. �@�@�@��Consideration 2�� �@�@�@�@�@�@�@Find the local minimum from the graph. �@�@�@��Consideration 3�� �@�@�@�@�@�@�@Find the maximum value from the graph. �@�@�@��Consideration 4�� �@�@�@�@�@�@�@Find the minimum value from the graph. �@ |
| �y�V�O�Q�z For 0��x��2�� , draw the graph of the function y=x+2sinx. | |||||||||||||||||||||||||||||||||
| �@��Procedure�� �@�@�@(1) Create the following correspondence table on a worksheet.
�@�@�@��Reference�� �@�@�@�@�@�sHow to complete the worksheet above�t �@�@�@�@�@�@�@Enter 0 in half-width in cell B12. �@�@�@�@�@�@�@Enter =B12+2 in half-width in cell B13. �@�@�@�@�@�@�@Right-click on the cell B13 and select Copy. �@�@�@�@�@�@�@Drag the cell range B14:B192 , right-click , and select Paste. �@�@�@�@�@�@�@Enter =RADIANS(B12)+2*SIN(RADIANS(B12)) in half-width in cell C12. �@�@�@�@�@�@�@Right-click on the cell C12 and select Copy. �@�@�@�@�@�@�@Drag the cell range C13:C192 , right-click , and select Paste. �@�@�@(2) Draw a graph from the correspondence table in (1) above. �@�@�@�@�@�@�@ Drag and select the cell range B11:C192 in the correspondence table of (1) above. �@�@�@�@�@�@�A Left-click �mIncert�n���mScatter plot�n���mSmooth line�n �@�@�@�@�@�@�B Drag the top and bottom edges of the graph area vertically to stretch and adjust. �@�@�@(3) Arrange the xy coordinate plane on which the graph is drawn. �@�@�@�@�@�@�@ Right-click on the numbers on the x-axis �� Axis formatting �� Scale interval Fixed 60.0 �@�@�@�@�@�@�� Close �� Right-click on the numbers on the x-axis �� Add gridlines �@�@�@�@�@�@ 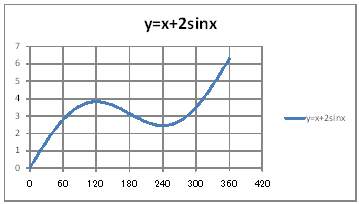 �@�@�@��Consideration 1�� �@�@�@�@�@�@�@Use a graph to find the value of x that takes the local maximum value when 0��x��2��.�@Then caluculate the local maximum value. �@�@�@��Consideration 2���@ �@�@�@�@�@�@�@Use a graph to find the value of x that takes the local miniimum value when 0��x��2��.�@Then caluculate the local minimum value. �@�@�@��Consideration 3�� �@�@�@�@�@�@�@Use a graph to find the value of x that takes the maximum value when 0��x��2��.�@Then caluculate the maximum value. �@�@�@��Consideration 4�� �@�@�@�@�@�@�@Use a graph to find the value of x that takes the miniimum value when 0��x��2��.�@Then caluculate the minimum value. �@ |
| �y�V�O�R�z Draw a graph of the function y=x+��(4-x^2) | |||||||||||||||||||||||||||||||||
| �@��Procedure�� �@�@�@(1) Create the following correspondence table on a worksheet.
�@�@�@��Reference�� �@�@�@�@�@�sHow to complete the worksheet above�t �@�@�@�@�@�@�@Enter -2 in half-width in cell B12. �@�@�@�@�@�@�@Enter =B12+0.1 in half-width in cell B13. �@�@�@�@�@�@�@Right-click on the cell B13 and select Copy. �@�@�@�@�@�@�@Drag the cell range B14:B52 and right-click , and select Paste. �@�@�@�@�@�@�@Enter =B12+SQRT(4-B12^2) in half-width in cell C12. �@�@�@�@�@�@�@Right-click on the cell C12 and select Copy. �@�@�@�@�@�@�@Drag the cell range C13:C52 and right-click , and select Paste. �@�@�@�@�@�@�@Enter 2 in half-width in cell C52. �@�@�@(2) Draw a graph from the correspondence table in (1) above. �@�@�@�@�@�@�@ Drag and select the cell range B11:C52 in the correspondence table of (1) above. �@�@�@�@�@�@�A Left-click �mIncert�n���mScatter plot�n���mSmooth line�n �@�@�@�@�@�@�B Drag the top and bottom edges of the graph area vertically to stretch and adjust. �@�@�@(3) Arrange the xy coordinate plane on which the graph is drawn. �@�@�@�@�@�@�@ Right-click on the numbers on the x-axis �� Add gridlines �@�@�@�@�@�@ 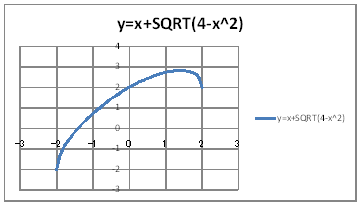 �@�@�@��Consideration�� �@�@�@�@�@�@�@Find the minimum value and the value of x at that time from the graph. |
| �y�V�O�S�z When -1��x��1 , draw a graph of the function y=e^(2x)-2e^x+1 | |||||||||||||||||||||||||||||||||
| �@��Procedure�� �@�@�@(1) Create the following correspondence table on a worksheet.
�@�@�@��Reference�� �@�@�@�@�@�sHow to complete the worksheet above�t �@�@�@�@�@�@�@Enter -1 in half-width in cell B12. �@�@�@�@�@�@�@Enter =B12+0.05 in half-width in cell B13. �@�@�@�@�@�@�@Right-click on the cell B13 and select Copy. �@�@�@�@�@�@�@Drag the cell range B14:B52 , right-click , and select Paste. �@�@�@�@�@�@�@Enter =EXP(2*B12)-2*EXP(B12)+1 in half-width in cell C12. �@�@�@�@�@�@�@Right-click on the cell C12 and select Copy. �@�@�@�@�@�@�@Drag the cell range C13:C52 , right-click , and select Paste. �@�@�@(2) Draw a graph from the correspondence table in (1) above. �@�@�@�@�@�@�@ Drag and select the cell range B11:C52 in the correspondence table of (1) above. �@�@�@�@�@�@�A Left-click �mIncert�n���mScatter plot�n���mSmooth line�n �@�@�@�@�@�@�B Drag the top and bottom edges of the graph area vertically to stretch and adjust. �@�@�@(3) Arrange the xy coordinate plane on which the graph is drawn. �@�@�@�@�@�@�@ Riht-click on the numbers on the x-axis �� Add gridlines �@�@�@�@�@�@ 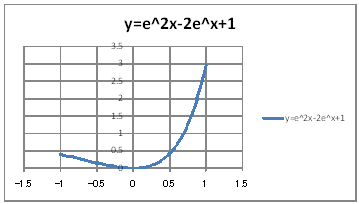 �@�@�@��Consideration 1�� �@�@�@�@�@�@�@When -1��x��1 , find the maximum value and the value of x at the time using the graph. �@�@�@��Consideration 2�� �@�@�@�@�@�@�@When -1��x��1 , find the minimum value and the value of x at the time using the graph. �@ |
| �@To table of contents�@ |
| �@�y�W�O�P�z Find the area enclosed by the curve y=x^2 , the x-axis , and the straight line x=1 using the piecewise method. | ||||||||||||||||||||||||||||||||||||||||||||||||
| �@��Procedure�� �@�@�@(1) Create the following correspondence table on a worksheet.
�@�@�@��Reference�� �@�@�@�@�@�sHow to complete the worksheet above�t �@�@�@�@�@�@�@Enter 0.01 in halh-width in cell B12. �@�@�@�@�@�@�@Enter =B12+0.01 in halh-width in cell B13. �@�@�@�@�@�@�@Right-click on the cell B13 and select Copy. �@�@�@�@�@�@�@Drag the cell range B14:B111 , right-click , and select Paste. �@�@�@�@�@�@�@Enter =B12^2 in halh-width in cell C12. �@�@�@�@�@�@�@Enter =0.01*C12 in halh-width in cell D12. �@�@�@�@�@�@�@Right-click the cell range C12:D12 , and select Copy. �@�@�@�@�@�@�@Drag the cell range C13:C111 , right-click , and select Paste. �@�@�@(2) Find the piecewisw from the correspondence table in (1) abobe. �@�@�@�@�@�@�@ Find the sum of the cell range D12:D111 in the correspondence table in (1) above. �@�@ �@�@�@�@�@�@Enter =SUM(D12:D111) in half-width in cell D112 .of the worksheet. �@�@�@��Consideration 1�� �@�@�@�@�@�@�@Calcurate the following definite integral and find the area enclosed by the curve y=x^2 , the x-axis , and the straight line x=1. �@�@�@�@�@�@�@ �@�@�@��Consideration 2�� �@�@�@�@�@�@�@Compare the value of the definite integral obtained in consideration 1 with the value of D112 , which is the sum of the cell range D12:D111 in the correspondence table of the worksheet. �@ |
| �@�y�W�O�Q�z Draw a graph of cycloid �������|���������A�����P�|�������� (�O�������Q��). Also , find its length. | ||||||||||||||||||||||||||||||||||||||||||||||||||||||||||||||||||||||||||||||||||||
| �@��Procedure�� �@�@�@(1) Create the following correspondence table on a worksheet.
�@�@�@��Reference�� �@�@�@�@�@�sHow to complete the worksheet above�t �@�@�@�@�@�@�@Enter 0 in half-width in cell B12. �@�@�@�@�@�@�@Enter =B12+2 in half-width in cell B13. �@�@�@�@�@�@�@Right-click on the cell B13 and select Copy. �@�@�@�@�@�@�@Drag the cell range B14:B192 , right-click , and select Paste. �@�@�@�@�@�@�@Enter =RADIANS(B12)-SIN(RADIANS(B12)) in half-width in cell C12. �@�@�@�@�@�@�@Enter =1-COS(RADIANS(B12)) in half-width in cell D12 �@�@�@�@�@�@�@Drag the cell range C12:D12 , right-click , and select Copy. �@�@�@�@�@�@�@Drag the cell range C13:D192 , right-click , and select Paste. �@�@�@�@�@�@�@Enter =C13-C12 in half-width in cell E13. �@�@�@�@�@�@�@Enter =D13-D12 in half-width in cell F13. �@�@�@�@�@�@�@Enter =SQRT(E13^2+F13^2) in half-width in cell G13. �@�@�@�@�@�@�@Drag the cell range E13:G13 , right-click , and select Copy. �@�@�@�@�@�@�@Drag the cell range E14:E192 , right-click , and select Paste. �@�@�@(2) Draw a graph from the correspondence table in (1) above. �@�@�@�@�@�@�@ Drag and select the cell range C11:D192 in the correspondence table of (1) above. �@�@�@�@�@�@�A Left-click �mIncert�n���mScatter plot�n���mSmooth line�n �@�@�@�@�@�@�B Drag the top and bottom edges of the graph area vertically to stretch and adjust. �@�@�@(3) Arrange the xy-coordinate plane on which the graph is drawn. �@�@�@�@�@�@�@ Right-click on the numbers on the x-axis �� Add gridlines �@�@�@(4) Find the length of the cycloid from the correspondence table in (1) above. �@�@�@�@�@�@�@ Find the sum of the cell range G13:G192 in the correspondence table of (1) above. �@�@ �@�@�@�@�@�@Enter =SUM(G13:G192) in half-width in cell G193 of the worksheet. �@�@�@�@�@�@ 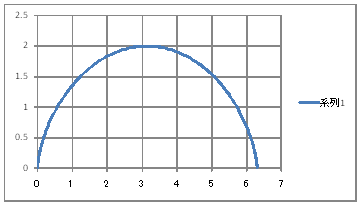 �@�@�@��Consideration 1�� �@�@�@�@�@�@�@Calculate the following definite integral and find the length of the cycloid �������|���������A�����P�|�������� (�O�������Q��) �@�@�@�@�@�@�@  �@�@�@��Consideration 2�� �@�@�@�@�@�@�@Compare the value of the definite integral obtained in Consideration 1 with the value of cell G193 , which is the sum of the cell range G13:G192 in the correspondence table of the worksheet. �@ |
| �@To table of contents�@ |
| �@�y�X�O�P�z Find the general terms of the arithmetic progression where the 3rd term is 5 and the 12th term is 59. | |||||||||||||||||||||||||||||||||
| �@��Procedure�� �@�@�@�@�@�@�@Let�@ �@�@�@�@�@�@�@�@�@�@ �@�@�@�@�@�@�@�@�@�@ �@�@�@�@�@�@�@�@�@�@If you solve �@ and �A simultaneously , �����|�V�A�����U �@�@�@�@�@�@�@�@�@�@Therefore , �@�@�@�@�@�@�@�@�@�@�@ �@ �@ �@ �@ �@�@�@(1) Create the following correspondence table on a worksheet.
�@�@�@��Reference�� �@�@�@�@�@�sHow to complete the worksheet above�t �@�@�@�@�@�@�@Enter 1 in half-width in cell B12. �@�@�@�@�@�@�@Enter =B12+1 in half-width in cell B13. �@�@�@�@�@�@�@Right-click on the cell B13 and select Copy. �@�@�@�@�@�@�@Drag the cell range B14:B111 , right-click , and select Paste. �@�@�@�@�@�@�@Enter =6*B12-13 in half-width in cell C12. �@�@�@�@�@�@�@Right-click cell C12 , right-click , and select Copy. �@�@�@�@�@�@�@Drag the cell range C13:C111 , right-click , and select Paste. �@�@�@��Consideration 1�� �@�@�@�@�@�@�@Solving for a(n)=6n-13=143 gives n=26. �@�@�@�@�@�@�@Check on the worksheet that 143 is the 26th term. �@�@�@��Consideration 2�� �@�@�@�@�@�@�@ �@�@�@�@�@�@ Check on the worksheet that the 96th term is 563. �@ |
| �@�y�X�O�Q�z Find the general terms of the geometric progression where the 3rd term is 12 and the 7th term is 192. | ||||||||||||||||||||||||||||||||||||||||||||
| �@��Procedure�� �@�@�@�@�@�@�@�@�@ �@Let �@�@�@�@�@�@�@�@�@�@ �@�@�@�@�@�@�@�@�@�@ �@�@�@�@�@�@�@�@�@�@Solving �@ and �A simultaneously gives �����R�A�����}�Q �@�@�@�@�@�@�@�@�@�@Therefore , �@�@�@(1) Create the following correspondence table on a worksheet.
�@�@�@��Reference�� �@�@�@�@�@�sHow to complete the worksheet above�t �@�@�@�@�@�@�@Enter the information in the cell range B11:D111 as shown in the table above. �@�@�@�@�@�@�@Enter 1 in half-width in cell B12. �@�@�@�@�@�@�@Enter =B12+1 in half-width in cell B13. �@�@�@�@�@�@�@Right-click on the cell B13 and select Copy. �@�@�@�@�@�@�@Drag the cell range B14:B46 , right-click , and select Paste. �@�@�@�@�@�@�@Enter =3*2^(B12-1) in half-width in cell C12. �@�@�@�@�@�@�@Enter =3*(-2)^(B12-1) in half-width in cell D12. �@�@�@�@�@�@�@Drag the cell range C12:D12 , right-click , and select Copy. �@�@�@�@�@�@�@Drag the cell range C13:C46 , right-click , and select Paste. �@�@�@��Consideration 1�� �@�@�@�@�@�@�@ �@�@�@�@�@�@�@ �@�@�@�@�@�@�@Check on the worksheet that the 8th term is 384 and -384. �@�@�@��Consideration 2�� �@�@�@�@�@�@�@Solving a(n)=3*2^(n-1)=786432 gives n=19. �@�@�@�@�@�@�@Solving a(n)=3*(-2)^(n-1)=786432 gives n=19. �@�@�@�@�@�@�@Check on the worksheet that 786432 is the 19th term. �@ |
| �@�y�X�O�R�zFind the sum from the first term to the nth term of an arithmetic progression where the first term is 50 and the commom difference is -6. | |||||||||||||||||||||||||||||||||||||||||||||||||||||||
| �@��Procedure�� �@�@�@�@�@�@�@�@�@�@ �@�@�@�@�@�@�@�@�@�@ �@�@�@(1) Create the following correspondence table on a worksheet.
�@�@�@��Reference�� �@�@�@�@�@�sHow to complete the worksheet above�t �@�@�@�@�@�@�@Drag the cell range B11:E11 , right-click and select Cell formatting. �@�@�@�@�@�@�@Select Tablar format �� Classification string�� OK �@�@�@�@�@�@�@Enter 1 in half-width in cell B12. �@�@�@�@�@�@�@Enter =B12+1 in half-width in cell B13. �@�@�@�@�@�@�@Right-click on the cell B13 and select Copy. �@�@�@�@�@�@�@Drag the cell range B14:B61 , right-click , and select Paste. �@�@�@�@�@�@�@Enter =-6*B12+56 in half-width in cell C12. �@�@�@�@�@�@�@Right-click on the cell C12 and select Copy. �@�@�@�@�@�@�@Drag the cell range C13:C61 , right-click , and select Paste. �@�@�@�@�@�@�@Enter 50 in half-width in cell D12. �@�@�@�@�@�@�@Enter =D12+C13 in half-width in cell D13. �@�@�@�@�@�@�@Right-click on the cell D13 and select Copy. �@�@�@�@�@�@�@Drag the cell range D14:D61 , right-click , and select Paste. �@�@�@�@�@�@�@Enter =-3*B12^2+53*B12 in half-width in cell E12. �@�@�@�@�@�@�@Right-click on the cell E12 and select Copy. �@�@�@�@�@�@�@Drag the cell range E13:E61 , right-click , and select Paste. �@�@�@��Consideration 1�� �@�@�@�@�@�@�@Make sure that the sum in column D of the worksheet matches -3n^2+53n in column E. �@�@�@��Consideration 2�� �@�@�@�@�@�@�@ �@�@�@�@�@�@�@ �@�@�@�@�@�@�@Therefore , when n=9 , it is maximum. �@�@�@�@�@�@�@Check on the worksheet that when n=9 , it is the maximum. |
| �@�y�X�O�S�zFind the sum from the first term to the nth term of a geometric progression with an initial term of 1/2 and a common ratio of 2. | |||||||||||||||||||||||||||||||||||||||||||||||||||||||
| �@��Procedure�� �@�@�@�@�@�@�@�@�@�@ �@�@�@�@�@�@�@�@�@�@ �@�@�@(1) Create the following correspondence table on a worksheet.
�@�@�@��Reference�� �@�@�@�@�@�sHow to complete the woksheet above�t �@�@�@�@�@�@�@Enter 1 in half-width in cell B12. �@�@�@�@�@�@�@Enter =B12+1 in half-width in cell B13. �@�@�@�@�@�@�@Right-click on the cell B13 and select Copy. �@�@�@�@�@�@�@Drag the cell range B14:B46 , right-click , and select Paste. �@�@�@�@�@�@�@Enter =2^(B12-2) in half-width in cell C12. �@�@�@�@�@�@�@Right-click on the cell C12 and select Copy. �@�@�@�@�@�@�@Drag the cell range B13:C46 , right-click , and select Paste. �@�@�@�@�@�@�@Enter 0.5 in half-width in cell D12. �@�@�@�@�@�@�@Enter =D12+C13 in half-width in cell D13. �@�@�@�@�@�@�@Right-click on the cell D13 and select Copy. �@�@�@�@�@�@�@Drag the cell range D14:D46 , right-click , and select Paste. �@�@�@�@�@�@�@Enter =(2^B12-1)/2 in half-width in cell E12. �@�@�@�@�@�@�@Right-click on the cell E12 and select Copy �@�@�@�@�@�@�@Drag the cell range E13:E46 , right-click , and select Paste. �@�@�@��Consideration 1�� �@�@�@�@�@�@�@Make sure that the sum in column D of the worksheet matches (2^n-1)/2 in column E. �@�@�@��Consideration 2�� �@�@�@�@�@�@�@ �@�@�@�@�@�@�@Solving this gives n=11. �@�@�@�@�@�@�@Check on the sheet that the fist term the sum exceedds 1000 is the sum up to the 11th term. �@ |
| �@�y�X�O�T�z Find the sum from 1^2 to n^2. | |||||||||||||||||||||||||||||||||||||||||||||||||||||||
| �@��Procedure�� �@�@�@�@�@�@�@�@�@�@ �@�@�@�@�@�@�@�@�@�@ �@�@�@(1) Create the following correspondence table on a worksheet.
�@�@�@��Reference�� �@�@�@�@�@�sHow to complete the worksheet above�t �@�@�@�@�@�@�@Enter 1 in half-width in cell B12. �@�@�@�@�@�@�@Enter =B12+1 in half-width in cell B13. �@�@�@�@�@�@�@Right-click on the cell B13 and select Copy. �@�@�@�@�@�@�@Drag the cell range B14:B46 ,right-click . and select Paste. �@�@�@�@�@�@�@Enter =B12^2 in half-width in cell C12. �@�@�@�@�@�@�@Right-click on the cell C12 and select Copy. �@�@�@�@�@�@�@Drag the cell range C13:C46 ,right-click . and select Paste. �@�@�@�@�@�@�@Enter 1 in half-width in cell D12. �@�@�@�@�@�@�@Enter =D12+C13 in half-width in cell D13. �@�@�@�@�@�@�@Right-click on the cell D13 and select Copy. �@�@�@�@�@�@�@Drag the cell range D14:D46 ,right-click . and select Paste. �@�@�@�@�@�@�@Enter =B12*(B12+1)*(2*B12+1)/6 in half-width in cell E12. �@�@�@�@�@�@�@Right-click on the cell E12 and select Copy. �@�@�@�@�@�@�@Drag the cell range E13:E46 ,right-click . and select Paste. �@�@�@��Consideration�� �@�@�@�@�@�@�@Make sure that the sum in column D of the worksheet matches n(n+1)(2n+1)/6 in column E. |
| �@�y�X�O�U�z Find the sum from 1^3 to n^3. | |||||||||||||||||||||||||||||||||||||||||||||||||||||||
| �@��Procedure�� �@�@�@�@�@�@�@�@�@�@ �@�@�@�@�@�@�@�@�@�@ �@�@�@(1) Create the following correspondence table on a worksheet.
�@�@�@��Reference�� �@�@�@�@�@�sHow to complete the worksheet above�t �@�@�@�@�@�@�@Enter 1 in half-width in cell B12. �@�@�@�@�@�@�@Enter =B12+1 in half-width in cell B13. �@�@�@�@�@�@�@Right-click on the cell B13 and select Copy. �@�@�@�@�@�@�@Drag the cell range B14:B46 , right-click , and select Paste. �@�@�@�@�@�@�@Enter =B12^3 in half-width in cell C12. �@�@�@�@�@�@�@Right-click on the cell C12 and select Copy. �@�@�@�@�@�@�@Drag the cell range C13:C46 , right-click , and select Paste. �@�@�@�@�@�@�@Enter 1 in half-width in cell D12. �@�@�@�@�@�@�@Enter =D12+C13 in half-width in cell D13. �@�@�@�@�@�@�@Right-click on the cell D13 and select Copy. �@�@�@�@�@�@�@Drag the cell range D14:D46 , right-click , and select Paste. �@�@�@�@�@�@�@Enter =(B12*(B12+1)/2)^2 in half-width in cell E12. �@�@�@�@�@�@�@Right-click on the cell E12 and select Copy. �@�@�@�@�@�@�@Drag the cell range E13:E46 , right-click , and select Paste. �@�@�@��Consideration�� �@�@�@�@�@�@�@Make sure that the sum in column D of the worksheet matches {n(n+1)/2}^2 in column E. |
| �@�y�X�O�V�zFind the general term of the following sequence. �@�@�@�@�@�@�R�C�S�C�U�C�P�O�C�P�W�C�R�S�C�E�E�E |
|||||||||||||||||||||||||||||||||||||||||||||||||||||||
| �@��Procedure�� �@�@�@(1) Create the following correspondence table on the worksheet.
�@�@�@��Referrence�� �@�@�@�@�@�sHow to complete the worksheet above�t �@�@�@�@�@�@�@Enter 1 in half-width in cell B12. �@�@�@�@�@�@�@Enter =B12+1 in half-width in cell B13. �@�@�@�@�@�@�@Right-click on the cell B13 and select Copy. �@�@�@�@�@�@�@Drag the cell range B14:B46 , right-click , and select Paste. �@�@�@�@�@�@�@Enter =2^(B13-2) in half-width in cell C13. �@�@�@�@�@�@�@Right-click on the cell C13 and select Copy. �@�@�@�@�@�@�@Drag the cell range C14:C46 , right-click , and select Paste. �@�@�@�@�@�@�@Enter 3 in half-width in cell D12. �@�@�@�@�@�@�@Enter =D12+C13 in half-width in cell D13. �@�@�@�@�@�@�@Right-click on the cell D13 and select Copy. �@�@�@�@�@�@�@Drag the cell range D14:D46 , right-click , and select Paste. �@�@�@�@�@�@�@Enter =2^(B12-1)+2 in half-width in cell E12. �@�@�@�@�@�@�@Right-click on the cell E12 and select Copy. �@�@�@�@�@�@�@Drag the cell range E13:E46 , right-click , and select Paste. �@�@�@��Consideration�� �@�@�@�@�@�@�@Make sure that the sum in column D of the worksheet matches 2^(n-1)+2 in column E. |
| �@�y�X�O�W�zFind the general term of the sequence {a(n)} defined by the following
recurrence formula. �@�@�@�@�@�@ �@�@�@�@�@�@ |
||||||||||||||||||||||||||||||||||||||||||||
| �@��Procedure�� �@�@�@�@�@�@�@�@�@�@When a(n+1) =2a(n)+3 is transformed , a(n+1)+3=2{a(n)+3} �@�@�@�@�@�@�@�@�@�@Sequence {a(n)+3} is a geometric progression where the first term is 4 and the common ratio is 2. �@�@�@�@�@�@�@�@�@�@Therefore , a(n)+3=4�~2^(n-1)=2^(n+1) �@�@�@�@�@�@�@�@�@�@a(n)=2^(n+1)-3 �@�@�@(1) Create the following correspondence table on a worksheet.
�@�@�@��Reference�� �@�@�@�@�@�sHow to complete the worksheet above�t �@�@�@�@�@�@�@Enter 1 in half-width in cell B12. �@�@�@�@�@�@�@Enter =B12+1 in half-width in cell B13. �@�@�@�@�@�@�@Right-click on the cell B13 and select Copy. �@�@�@�@�@�@�@Drag the cell range B14:B46 , right-click , and select Paste. �@�@�@�@�@�@�@Enter 1 in half-width in cell C12. �@�@�@�@�@�@�@Enter =2*C12+3 in half-width in cell C13. �@�@�@�@�@�@�@Right-click on the cell C13 and select Copy. �@�@�@�@�@�@�@Drag the cell range C14:C46 , right-click , annd select Paste. �@�@�@�@�@�@�@Enter =2^(B12+1)-3 in half-width in cell D12. �@�@�@�@�@�@�@Right-click on the cell D12 and select Copy. �@�@�@�@�@�@�@Drag the cell range D13:D46 , right-click , annd select Paste. �@�@�@��Reference�� �@�@�@�@�@�@�@Make sure that the recurrence formula in column C of the worksheet matches 2^(n+1)-3 in column D. |
| �@�y�X�O�X�z Find the general term of the sequence {a(n)} defined by the following
recurrence formula. �@�@�@�@�@�@�@�@ �@�@�@�@�@�@�@�@ �@�@�@�@�@�@�@�@ |
||||||||||||||||||||||||||||||||||||||||||||
| �@��Procedure�� �@�@�@�@�@�@�@�@�@�@Solve this recurrence formula to find the general term. �@�@�@�@�@�@�@�@�@�@  �@ �@�@�@�@�@�@�@�@�@�@�@ �@�@�@�@�@�@�@�@�@�@ �@�@�@(1) Create the following correspondence table on a worksheet.
�@�@�@��Reference�� �@�@�@�@�@�sHow to complete the worksheet above�t �@�@�@�@�@�@�@Enter 1 in half-width in cell B12. �@�@�@�@�@�@�@Enter =B12+1 in half-width in cell B13. �@�@�@�@�@�@�@Right-click on the cell B13 and select Copy. �@�@�@�@�@�@�@Drag the cell range B14:B46 , right-click , and select Paste. �@�@�@�@�@�@�@Enter 0 in half-width in cell C12. �@�@�@�@�@�@�@Enter 1 in half-width in cell C13. �@�@�@�@�@�@�@Enter =(2*C13+C12)/2 in half-width in cell C14 �@�@�@�@�@�@�@Right-click on the cell C14 and select Copy. �@�@�@�@�@�@�@Drag the cell range C15:C46 , right-click , and select Paste. �@�@�@�@�@�@�@Enter =(((1+SQRT(3))/2)^(B12-1)-((1-SQRT(3))/2)^(B12-1))/SQRT(3) in half-width in cell D12. �@�@�@�@�@�@�@Right-click on the cell D12 and select Copy. �@�@�@�@�@�@�@Drag the cell range D13:D46 , right-click , and select Paste. �@�@�@��Consideration�� �@�@�@�@�@�@�@Make sure that the recurrence formula in column C of the worksheet matches the general term in column D. |
| �@�y�X�P�O�z Consider the Febonacci sequence determined by the following recurrence
formula. �@�@�@�@�@�@�@ �@�@�@�@�@�@�@ �@�@�@�@�@�@�@ |
||||||||||||||||||||||||||||||||||||||||||||
| �@��Procedure�� �@�@�@(1) Create the following correspondence table on a worksheet.
�@�@�@��Reference�� �@�@�@�@�@�sHow to complete the worksheet above�t �@�@�@�@�@�@�@Enter 1 in half-width in cell B12. �@�@�@�@�@�@�@Enter =B12+1 in half-width in cell B13. �@�@�@�@�@�@�@Right-click on the B13 and select Copy. �@�@�@�@�@�@�@Drag the cell range B14:B61 , right-click , and select Paste. �@�@�@�@�@�@�@Enter 1 in half-width in cell C12. �@�@�@�@�@�@�@Enter 1 in half-width in cell C13. �@�@�@�@�@�@�@Enter =C12+C13 in half-width in cell C14. �@�@�@�@�@�@�@Right-click on the C14 and select Copy. �@�@�@�@�@�@�@Drag the cell range C15:C61 , right-click , and select Paste. �@�@�@�@�@�@�@Enter =C13/C12 in half-width in cell D13. �@�@�@�@�@�@�@Right-click on the D13 and select Copy. �@�@�@�@�@�@�@Drag the cell range D14:D61 , right-click , and select Paste. �@�@�@��Consideration�� �@�@�@�@�@�@�@Make sure that the value of (the 50th term/ the 49th term) in column D of the worksheet is close to the golden ratio (1+��5)/2��1.618033989. |
| �@To table of contens�@ |
| �@�y1001�z Inverse trigonometric functions and Conversion from arc degree
method to degree method �@�@�@�@�@�@�i�`�r�h�m function�A�`�b�n�r function�A�`�s�`�m function�A�c�d�f�q�d�d�r function�j |
|||||||||||||||||||||||||||||||||||||||||||||||||||||||||||||||||||||||||||||
| �@��Procedure�� �@�@�@(1) Create the following correspondence table on a worksheet.
�@�@�@��Reference�� �@�@�@�@�@�sHow to complete the worksheet above.�t �@�@�@�@�@�@�@Drag the cell range B12:B20 , right-click and select Cell formatting. �@�@�@�@�@�@�@Select Display format �� Classification string �� OK �@�@�@�@�@�@�@Enter data in the cell range B12:B20 as shown in the table above �@�@�@�@�@�@�@Drag the cell range D12:D20 , right-click ,and select Cell formatting �@�@�@�@�@�@�@Select Display format �� Classification string �� OK �@�@�@�@�@�@�@Enter data in the cell range D12:D20 as shown in the table above �@�@�@�@�@�@�@Drag the cell range F12:F20 , right-click ,and select Cell formatting �@�@�@�@�@�@�@Select Display format �� Classification string �� OK �@�@�@�@�@�@�@Enter data in the cell range F12:F18 as shown in the table above �@�@�@�@�@�@�@Enter =DEGREES(ASIN(-1)) in cell C12. �@�@�@�@�@�@�@Similarly , enter =DEGREES(ASIN(value in the same row of column B)) in half-width from C13 to C20 �@�@�@�@�@�@�@Enter =DEGREES(ACOS(1)) in cell E12. �@�@�@�@�@�@�@Similarly , enter =DEGREES(ACOS(value in the same row of column D)) in half-width from E13 to E20 �@�@�@�@�@�@�@Enter =DEGREES(ATAN(-SQRT(3))) in cell G12. �@�@�@�@�@�@�@Similarly , enter =DEGREES(ACOS(value in the same row of column F)) in half-width from G13 to G18 �@�@�@��About functions�� �@�@�@�@�@�@�@�`�r�h�m function��� ASIN(real number 1) �@�@�@�@�@�@�@�@�@�@Return the angle of SIN that has a real number 1 in radians. �@�@�@�@�@�@�@�`�b�n�r function��� ACOS(real number 1) �@�@�@�@�@�@�@�@�@�@Return the angle of COS that has a real number 1 in radians. �@�@�@�@�@�@�@�`�s�`�m function��� ATAN(real number 1) �@�@�@�@�@�@�@�@�@�@Return the angle of TAN that has a real number 1 in radians. �@�@�@�@�@�@�@�c�d�f�q�d�d�r function��� DEGREES(���W�A��) �@�@�@�@�@�@�@�@�@�@Converts an angle in radians to an angle in degrees. �@ |
| �@�y1002�z Sum of squares of complex numbers �@�@�@�@�@�@�i�r�t�l�r�p function�j |
||||||||||||||||||||||||||||||||||||||||||||
| �@��Procedure�� �@�@�@(1) Create the following correspondence table on a worksheet.
�@�@�@��Reference�� �@�@�@�@�@�sHow to complete the worksheet above�t �@�@�@�@�@�@�@Drag the cell range B11:B20 , right-click , and select Cell formatting. �@�@�@�@�@�@�@Select Display format �� Classification string �� OK. �@�@�@�@�@�@�@Enter data in the cell range B11:B20 as shown in the table above. �@�@�@�@�@�@�@Enter =SQRT(0) in half-width in cell C12. �@�@�@�@�@�@�@Enter =SQRT(1) in half-width in cell C13. �@�@�@�@�@�@�@Enter =SQRT(2) in half-width in cell C14. �@�@�@�@�@�@�@Enter =SQRT(3) in half-width in cell C15. �@�@�@�@�@�@�@Enter =SQRT(4) in half-width in cell C16. �@�@�@�@�@�@�@Enter =SQRT(5) in half-width in cell C17. �@�@�@�@�@�@�@Enter =SQRT(6) in half-width in cell C18. �@�@�@�@�@�@�@Enter =SQRT(7) in half-width in cell C19. �@�@�@�@�@�@�@Enter =SQRT(8) in half-width in cell C20. �@�@�@�@�@�@�@Enter =SUMSQ(C12,C13) in half-width in cell D13. �@�@�@�@�@�@�@Right-click on the cell D13 and select Copy. �@�@�@�@�@�@�@Drag the cell range D14:D20 , right-click , and select Paste. �@�@�@��About function�� �@�@�@�@�@�@�@�r�t�l�r�p function��� SUMSQ(real number 1�Creal number 2) �@�@�@�@�@�@�@�@�@�@ Returns the value of (real number 1)^2 + (real number 2)^2 �@ |
| �@�y1003�z Four arithmetic calculations of complex numbers <sum , difference
, product , quotient> and display in complex number format �@�@�@�@�@�@�i�h�l�r�t�l function �A�h�l�r�t�a function �A�h�l�o�q�n�c�t�b�s function �A�h�l�c�h�u function �A�b�n�l�o�k�d�w function�j |
||||||||||||||||||||||||||||||||||||||||||||||||||||||||
| �@��Procedure�� �@�@�@(1) Create the correspondence table on a worksheet.
�@�@�@��Reference�� �@�@�@�@�@�sHow to complete the worksheet above�t �@�@�@�@�@�@�@Enter A= in cell C11. �@�@�@�@�@�@�@Enter B= in cell C12. �@�@�@�@�@�@�@Enter =COMPLEX(5,-3) in half-width in cell D11. �@�@�@�@�@�@�@Enter =COMPLEX(-2,7) in half-width in cell D12. �@�@�@�@�@�@�@Enter C= in half-width in cell F11. �@�@�@�@�@�@�@Enter D= in half-width in cell F12. �@�@�@�@�@�@�@Enter =COMPLEX(2,1) in half-width in cell G11. �@�@�@�@�@�@�@Enter =COMPLEX(2,-1) in half-width in cell G12. �@�@�@�@�@�@�@Enter data in the cell range B14:B17 as shown in the table above. �@�@�@�@�@�@�@Enter data in the cell range C14:C17 as shown in the table above. �@�@�@�@�@�@�@Enter =IMSUM(D11,D12) in half-width in cell D14. �@�@�@�@�@�@�@Enter =IMSUB(D11,D12) in half-width in cell D15. �@�@�@�@�@�@�@Enter =IMPRODUCT(D11,D12) in half-width in cell D16. �@�@�@�@�@�@�@Enter =IMDIV(G11,G12) in half-width in cell D17. �@�@�@��About functions�� �@�@�@�@�@�@�@�h�l�r�t�l function��� IMSUM(complex number 1�Ccomplex number 2) �@�@�@�@�@�@�@�@�@�@Returns the value of (complex number 1 + complex number 2) �@�@�@�@�@�@�@�h�l�r�t�a function��� IMSUB(complex number 1�Ccomplex number 2) �@�@�@�@�@�@�@�@�@�@Returns the value of (comlex number 1 - complex number 2) �@�@�@�@�@�@�@�h�l�o�q�n�c�t�b�s function��� IMPRODUCT(comlex number 1�Ccomplex number 2) �@�@�@�@�@�@�@�@�@�@Returns the value of (comlex number 1 �~ complex number 2) �@�@�@�@�@�@�@�h�l�c�h�u function��� IMDIV(comlex number 1�Ccomplex number 2) �@�@�@�@�@�@�@�@�@�@Returns the value of (comlex number 1 �� complex number 2) �@�@�@�@�@�@�@�b�n�l�o�k�d�w function��� COMPLEX(real number 1�Creal number 2) �@�@�@�@�@�@�@�@�@�@Returns the complex number form (real number 1) + (real number 2) i |
| �@�y1004�zConjugate complex number and Abloluete values �@�@�@�@�@�@�i�h�l�b�n�m�i�t�f�`�s�d function�A�h�l�`�a�r function�j |
||||||||||||||||||||
| �@��Procedure�� �@�@�@(1) Create the following correspondence table on a worksheet.
�@�@�@��Reference�� �@�@�@�@�@�sHow to compleete the worksheet above�t �@�@�@�@�@�@�@Enter 3+4i in half-width in cell B12. �@�@�@�@�@�@�@Enter 3 in half-width in cell B13. �@�@�@�@�@�@�@Enter 3i in half-width in cell B14. �@�@�@�@�@�@�@Enter =IMCONJUGATE(B12) in half-width in cell C12. �@�@�@�@�@�@�@Enter =IMCONJUGATE(B13) in half-width in cell C13. �@�@�@�@�@�@�@Enter =IMCONJUGATE(B14) in half-width in cell C14. �@�@�@�@�@�@�@Enter =IMABS(B12) in half-width in cell D12. �@�@�@�@�@�@�@Enter =IMABS(B13) in half-width in cell D13. �@�@�@�@�@�@�@Enter =IMABS(B14) in half-width in cell D14. �@�@�@��About functions�� �@�@�@�@�@�@�@�h�l�b�n�m�i�t�f�`�s�d function��� IMCONJUGATE(complex number 1) �@�@�@�@�@�@�@�@�@�@Returns complex number that is the conjugate of complex number 1. �@�@�@�@�@�@�@�h�l�`�a�r function��� IMABS(complex number 1) �@�@�@�@�@�@�@�@�@�@Returns the absolute value of a complex number 1. �@ |
| �@�y1005�zargument , real part , imaginary part of complex number �@�@�@�@�@�@�i�h�l�`�q�f�t�l�d�m�s function�A�h�l�q�d�`�k function�A�h�l�`�f�h�m�`�q�x function�j |
||||||||||||||||||||||||||||||||||||||||||||||||||||||||||||||||||
| �@��Procedure�� �@�@�@(1) Create the following correspondence table on a worksheet.
�@�@�@��Reference�� �@�@�@�@�@�sHow to complete the worksheet above�t �@�@�@�@�@�@�@Drag the cell range B11:B20 , right-click and select Cell formatting. �@�@�@�@�@�@�@Select Display format �� Classification string �� OK �@�@�@�@�@�@�@Enter data in the ccll range B11:B20 as shown in the table above. �@�@�@�@�@�@�@Enter =COMPLEX(1,0) in half-width in cell C12. �@�@�@�@�@�@�@Enter =COMPLEX(SQRT(3),1) in half-width in cell C13. �@�@�@�@�@�@�@Enter =COMPLEX(1,1) in half-width in cell C14. �@�@�@�@�@�@�@Enter =COMPLEX(1,SQRT(3)) in half-width in cell C15. �@�@�@�@�@�@�@Enter =COMPLEX(0,1) in half-width in cell C16. �@�@�@�@�@�@�@Enter =COMPLEX(-1,SQRT(3)) in half-width in cell C17. �@�@�@�@�@�@�@Enter =COMPLEX(SQRT(-1,1) in half-width in cell C18. �@�@�@�@�@�@�@Enter =COMPLEX(-SQRT(3),1) in half-width in cell C19. �@�@�@�@�@�@�@Enter =COMPLEX(-1,0) in half-width in cell C20. �@�@�@�@�@�@�@Enter =DEGREES(IMARGUMENT(C12)) in half-width in cell D12. �@�@�@�@�@�@�@Right-click on the cell D12 and select Copy. �@�@�@�@�@�@�@Drag the cell range D13:D20 , right-click and select Paste. �@�@�@�@�@�@�@Enter =IMREAL(C12) in half-width in cell E12. �@�@�@�@�@�@�@Right-click on the cell E12 and select Copy. �@�@�@�@�@�@�@Drag the cell range E13:E20 , right-click and select Paste. �@�@�@�@�@�@�@Enter =IMAGINARY(C12) in half-width in cell F12. �@�@�@�@�@�@�@Right-click on the cell F12 and select Copy. �@�@�@�@�@�@�@Drag the cell range F13:F20 , right-click and select Paste. �@�@�@��About functions�� �@�@�@�@�@�@�@�h�l�`�q�f�t�l�d�m�s function��� IMARGUMENT(complex number 1) �@�@�@�@�@�@�@�@�@�@Returns the argument of a complex number 1 in radians. unit �@�@�@�@�@�@�@�h�l�q�d�`�k function��� IMREAL(complex number 1) �@�@�@�@�@�@�@�@�@�@Returns the real part of a complex number 1. �@�@�@�@�@�@�@�h�l�`�f�h�m�`�q�x function��� IMAGINARY(complex number 1) �@�@�@�@�@�@�@�@�@�@Returns the imaginary part of a complex number 1. |
| �@�y1006�zThink of �@�@�@�@�@�@�@�@�@�@de Moivle's theorem �@�@�@�@�@�@�@�@�@�@�@�@ �@�@�@�@�@�@�@�@�@�@�@�@�i�h�l�o�n�v�d�q function�j |
||||||||||||||||||||||||||||||||||||||||||||||||||||||||||||||||||||||||||||||||
| �@��Procedure�� �@�@�@(1) Create the following correspondence table on a worksheet. �@�@�@��Reference�� �@�@�@�@�@Refer to �y401�z how to complete the worksheet.
�@�@�@��Reference�� �@�@�@�@�@�sHow to complete the worksheet above�t �@�@�@�@�@�@�@Enter data in the cell range B9:B23 as shown in the table above. �@�@�@�@�@�@�@Enter =COMPLEX(1,SQRT(3)) in half-width in cell C9. �@�@�@�@�@�@�@Enter data in the cell C11 as shown in the table above. �@�@�@�@�@�@�@Enter =IMPOWER($C$9,B12) in half-width in cell C12. �@�@�@�@�@�@�@Right-click on the cell C12 and select Copy. �@�@�@�@�@�@�@Drag the cell range C13:C23 , right-click and select Paste. �@�@�@�@�@�@�@Enter =DEGREES(IMAGUMENT(C12)) in half-width in cell D12. �@�@�@�@�@�@�@Right-click on the cell D12 and select Copy. �@�@�@�@�@�@�@Drag the cell range D13:D23 , right-click and select Paste. �@�@�@�@�@�@�@Enter =IMABS(C12) in half-width in cell E12. �@�@�@�@�@�@�@Right-click on the cell E12 and select Copy. �@�@�@�@�@�@�@Drag the cell range E13:E23 , right-click and select Paste. �@�@�@��About functions�� �@�@�@�@�@�@�@�h�l�o�n�v�d�q function��� IMPOWER(complex number 1�C��) �@�@�@�@�@�@�@�@�@�@Returns (complex number 1)^n. |
| �@�y1007�z�@When the points represented by ��,��, and ��are A , B ,and C respectively , find the magnitude of �ڂ`�a�b.�@�@�@�@�@�@�@ | ||||||||||||||||||||||||||||||||||||
| �@��Procedure�� �@�@�@�@�@�@�@�@�@�@For points �`(��)�A�a(��)�Aand �b(��) �@�@�@�@�@�@�@�@�@�@ �@�@�@(1) Create the following correspondence table on a worksheet.
�@�@�@��Reference�� �@�@�@�@�@�sHow to complete the worksheet above�t �@�@�@�@�@�@�@Enter data in the cell range B11:B18 as shown in the table above. �@�@�@�@�@�@�@Enter =COMPLEX(1+SQRT(3),-2+SQRT(3)) in half-width in cell C11. �@�@�@�@�@�@�@Enter =COMPLEX(0,-1) in half-width in cell C12. �@�@�@�@�@�@�@Enter =COMPLEX(1,-2) in half-width in cell C13. �@�@�@�@�@�@�@Enter =IMSUB(C11,C13) in half-width in cell C15. �@�@�@�@�@�@�@Enter =IMSUB(C12,C13) in half-width in cell C16. �@�@�@�@�@�@�@Enter data in the cell C18 as shown in the table above. �@�@�@�@�@�@�@Enter =DEGREES(IMARGUMENT(IMDIV(C16,C15))) in half-width in cell D18. �@�@�@��Consideration�� �@�@�@�@�@�@�@ �@�@�@�@�@�@�@���|�����|���|(�P�|�Q��)���|�P�{�� �@�@�@�@�@�@�@Calculate and find arg{(���|��)/(���|��)}. |
| �@To table of contents�@ |
| �@�y1101�z�@When the integer part of ��5 is a and the decimal part of ��5 is b , find the value of (a^2-b^2). | |||||||||||||||||||||
| �@��Procedure�� �@�@�@(1) Create the following correspondence table on a worksheet above.
�@�@�@��Reference�� �@�@�@�@�@�sHow to complete the worksheet above�t �@�@�@�@�@�@�@Enter data in the cell range B11:B16 as shown in the table above. �@�@�@�@�@�@�@Enter =TRUNC(SQRT(5)) in half-width in cell C11. �@�@�@�@�@�@�@Enter =SQRT(5)-C11 in half-width in cell C12. �@�@�@�@�@�@�@Enter =POWER(C11,2)-POWER(C12,2) in half-width in cell C14. �@�@�@�@�@�@�@Enter =4*SQRT(5)-5 in half-width in cell C16. �@�@�@��About functions�� �@�@�@�@�@�@�@�o�n�v�d�q function��� POWER(real number 1�C��) �@�@�@�@�@�@�@�@�@�@Returns (real number 1)^n �@�@�@�@�@�@�@�s�q�t�m�b function��� TRUNC(real number 1) �@�@�@�@�@�@�@�@�@�@Returns a real number 1 with the decimal part truncated. �@�@�@��Consideration�� �@�@�@�@�@�@�@Since a=2 , b=��5 - 2 �@�@�@�@�@�@�@ �@�@�@�@�@�@Make sure that the value of a^2-b^2 on the worksheet matches the value of 4��5 - 5. �@ |
| �@�y1102�z�@Find the value of a^2+8a when the decimal part of ��23 is a. | |||||||||||||||
| �@��Procedure�� �@�@�@(1) Create the following correspondence table on a worksheet.
�@�@�@��Reference�� �@�@�@�@�@�sHow to complete the worksheet above�t �@�@�@�@�@�@�@Enter data in the cell range B11:B14 as shown in the table above. �@�@�@�@�@�@�@Enter =TRUNC(SQRT(23)) in half-width in cell C11. �@�@�@�@�@�@�@Enter =SQRT(23)-C11 in half-width in cell C12. �@�@�@�@�@�@�@Enter =POWER(C12,2)+8*C12 in half-width in cell C14. �@�@�@��About functions�� �@�@�@�@�@�@�@�o�n�v�d�q function��� POWER(real number 1�Cn) �@�@�@�@�@�@�@�@�@�@Returns (real nimber 1)^n �@�@�@�@�@�@�@�s�q�t�m�b function ��� TRUNC(real number 1) �@�@�@�@�@�@�@�@�@�@Returns a real number 1 with the decimal part truncated. �@�@�@��Consideration�� �@�@�@�@�@�@�@Since a=��Q�R�@�|�@�S �@�@�@�@�@�@�@ �@�@�@�@�@�@�@Make sure that this matches the value of a^2+8a on the worksheet. �@ |
| �@To table of contens�@ |
| �@�y1201�z�@Regarding the tangent at point (t , t^3+t^2-2t) on the cubic function y=x^3+x^2-2x , observe the state of the tangent when t moves within the range of -2.8 to 2.1. | |||||||||||||||||||||||||||||||||||||||||||||||||||||||||||||||||||||||||||||||||
| �@��Procedure�� �@�@�@(1) Create the following correspondence table on a worksheet.
�@�@�@��Reference�� �@�@�@�@�@�sHow to complete the worksheet above�t �@�@�@�@�@�@�@Enter data in the cell range A2:A62 in increments of 0.1 as shown in the table above. �@�@�@�@�@�@�@Enter ��A2^3+A2^2-2*A2 in half-width in cell B2. �@�@�@�@�@�@�@Copy cell B2 to the cell range B3:B62. �@�@�@�@�@�@�@Enter ��(3*$F$2^2+2*$F$2-2)*A2-2*$F$2^3-$F$2^2 in half-width in cell C2. �@�@�@�@�@�@�@Copy cell C2 to the cell range C3:C62. �@�@�@�@�@�@�@Enter ��F2^3+F2^2-2*F2 in half-width in cell G2. �@�@�@(2) Draw a graph from the correspondence table in (1) above. �@�@�@�@�@�@�@ Drag and select the cell range A1:C62 in the correspondence table of (1) above. �@�@�@�@�@�@�A Left-click �mInsert�n���mScatter plot�n���mScatter line�n �@�@�@�@�@�@�B Delete the legend �@�@�@(3) Arrange the xy coordinate plane on which the graph is drawn. �@�@�@�@�@�@�@ Set the x-axis scale to -3 or more and 3 or less , and set the scale interval to 1. �@�@�@�@�@�@�A Set the y-axis scale to -10 or more and 10 or less , and set the scale interval to 1 �@�@�@�@�@�@�B Set the scale line style to dotted lines for both the x-axis and y-axis. 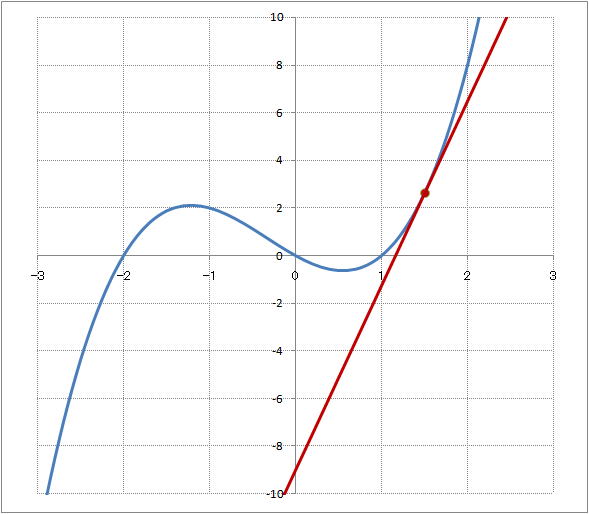 �@�@�@��About Macro�� �@�@�@�@�@�@�@ �@�@�@�@�@Sub Sessen() �@�@�@�@�@�@�@�@Dim t As Single �@�@�@�@�@ �@'Declare it as single-precision floating point type �@�@�@�@�@�@�@�@DoEvents �@�@�@�@�@�@�@�@�@�@ 'Allow you to force exit from ForNext repetition. �@�@�@�@�@�@�@�@For t = -2.8 To 2.1 Step 0.01 �@�@�@�@�@�@�@�@�@�@�@Cells(2, "F") = t �@�@�@'Assign the the value of t to row 2 and column F. �@�@�@�@�@�@�@�@�@�@�@Calculate �@�@�@�@�@�@�@ 'Recalculate �@�@�@�@�@�@�@�@Next �@�@�@�@�@End Sub �@�@�@��Consideration�� �@�@�@�@�@�@�@Let's run the macro and observe the movement of the tangent line. �@�@�@�@�@�@�@You can observe the state of the tangent line as the x-coordinate of the contact point changes from -2.8 to 2.1. �@ |
| �@�y1202�z�@Observe that the graph of the quadratic function y=a(x-p)^2+q is obtained by translaing the graph of y=ax^2 by +p in the x-axis direction and +q in the y-axis direction. | ||||||||||||||||||||||||||||||||||||||||||||||||||||||||||||||||||||||||||||||||||||||||||||||||||||||||||||||||||||||||
| �@��Procedure�� �@�@�@(1) Create the following correspondence table on a worksheet.
�@�@�@��Reference�� �@�@�@�@�@�sHow to complete the worksheet above�t �@�@�@�@�@�@�@Enter data in the cell range B3:B63 in increments of 0.1 as shown in the table above. �@�@�@�@�@�@�@Enter ��$G$2*(B3-$G$3)^2+$G$4 in half-width in cell C3 �@�@�@�@�@�@�@Copy the cell C3 to the cell range C4:C63. �@�@�@�@�@�@�@Enter ��$G$2*(B3-$I$8)^2+$J$8 in half-width in cell D3. �@�@�@�@�@�@�@Copy the cell D3 to the cell range D4:D63. �@�@�@�@�@�@�@Enter =I8 in half-width in cell I7. �@�@�@(2) Draw a graph from the correspondence table in (1) above. �@�@�@�@�@�@�@ Drag and select the cell range B2:D63 in the correspondence table of (1) above. �@�@�@�@�@�@�A Left-click �mIncert�n���mScatter plot�n���mScatter line�n �@�@�@�@�@�@�B Delete the legend. �@�@�@(3) Arrange the xy coordinate plane on which the graph is drawn. �@�@�@�@�@�@�@ Set the x-axis scale to -3 or more and 3 or less , and set the scale interval to 1. �@�@�@�@�@�@�A Set the y-axis scale to -10 or more and 10 or less , and set the scale interval to 1. �@�@�@�@�@�@�B Set the scale line style to dotted lines for the x-axis and y-axis.  �@�@�@�@�@ �@�@�@�@�@ �@�@�@��About macro�� �@�@�@�@�@�@�@ �@�@�@Option Explicit�@�@�@�@�@'Force bariable declaration �@�@�@Sub apq() �@�@�@�@�@�@�@Dim a, p, q As Single�@�@�@�@�@'Declare as simple-precision floating point type �@�@�@�@�@�@�@Dim sp, sq As Single�@�@�@�@�@'Declare as simple-precision floating point type �@�@�@�@�@�@�@sp = Cells(8, "I")�@�@�@�@�@'Assign the value of row 8 and column I to sp �@�@�@�@�@�@�@sq = Cells(8, "J")�@�@�@�@�@'Assign the value of row 8 and column J to sq �@�@�@�@�@�@�@Cells(3, "G") = 0�@�@�@�@�@'Write 0 in row 3 and couimn G �@�@�@�@�@�@�@Cells(4, "G") = 0�@�@�@�@�@'Write 0 in row 4 and column G �@�@�@�@�@�@�@DoEvents�@�@�@�@�@'Allow forcible exit from ForNext statement �@�@�@�@�@�@�@If sp > 0 And sq > 0 Then�@�@�@�@�@'If the vertex is in the first quadrant �@�@�@�@�@�@�@�@�@�@Cells(3, "G") = 0�@�@�@�@�@'Write 0 in row 3 and column G �@�@�@�@�@�@�@�@�@�@Cells(4, "G") = 0�@�@�@�@�@'Write 0 in row 4 and column G �@�@�@�@�@�@�@�@�@�@For p = 0 To sp Step 0.05 �@�@�@�@�@�@�@�@�@�@�@�@�@Cells(3, "G") = p�@�@�@�@�@'Write the value of p in row 3 and column G �@�@�@�@�@�@�@�@�@�@�@�@�@Calculate�@�@�@�@�@'Recaluculate �@�@�@�@�@�@�@�@�@�@Next�@p �@�@�@�@�@�@�@�@�@�@For q = 0 To sq Step 0.05 �@�@�@�@�@�@�@�@�@�@�@�@�@Cells(4, "G") = q�@�@�@�@�@'Write the value of q in row 4 and column G �@�@�@�@�@�@�@�@�@�@�@�@�@Calculate�@�@�@�@�@'Recalculate �@�@�@�@�@�@�@�@�@�@Next�@q �@�@�@�@�@�@�@End If �@�@�@�@�@�@�@If sp > 0 And sq < 0 Then�@�@�@�@�@'If the vertex is in the 4th quadrant �@�@�@�@�@�@�@�@�@�@Cells(3, "G") = 0�@�@�@�@�@'Write 0 in row 3 and column G �@�@�@�@�@�@�@�@�@�@Cells(4, "G") = 0�@�@�@�@�@'Write 0 in row 4 and column G �@�@�@�@�@�@�@�@�@�@For p = 0 To sp Step 0.05 �@�@�@�@�@�@�@�@�@�@�@�@�@Cells(3, "G") = p�@�@�@�@�@'Write the value of p in row 3 and column G �@�@�@�@�@�@�@�@�@�@�@�@�@Calculate�@�@�@�@�@'Recalculate �@�@�@�@�@�@�@�@�@�@Next p �@�@�@�@�@�@�@�@�@�@For q = 0 To sq Step -0.05 �@�@�@�@�@�@�@�@�@�@�@�@�@Cells(4, "G") = q�@�@�@�@�@'Write the value of q in row 4 and column G �@�@�@�@�@�@�@�@�@�@�@�@�@Calculate�@�@�@�@�@'Recalculate �@�@�@�@�@�@�@�@�@�@Next q �@�@�@�@�@�@�@End If �@�@�@�@�@�@�@If sp < 0 And sq > 0 Then�@�@�@�@�@'If the vertex is in the 2nd quadrant �@�@�@�@�@�@�@�@�@�@Cells(3, "G") = 0�@�@�@�@�@'Write 0 in row 3 and column G �@�@�@�@�@�@�@�@�@�@Cells(4, "G") = 0�@�@�@�@�@'Write 0 in row 4 and column G �@�@�@�@�@�@�@�@�@�@For p = 0 To sp Step -0.05 �@�@�@�@�@�@�@�@�@�@�@�@�@Cells(3, "G") = p�@�@�@�@�@'Write the value of p in row 3 and column G �@�@�@�@�@�@�@�@�@�@�@�@�@Calculate�@�@�@�@�@'Recalculate �@�@�@�@�@�@�@�@�@�@Next p �@�@�@�@�@�@�@�@�@�@For q = 0 To sq Step 0.05 �@�@�@�@�@�@�@�@�@�@�@�@�@Cells(4, "G") = q�@�@�@�@�@'Write the value of q in row 4 and column G �@�@�@�@�@�@�@�@�@�@�@�@�@Calculate�@�@�@�@�@'Recalculate �@�@�@�@�@�@�@�@�@�@Next q �@�@�@�@�@�@�@End If �@�@�@�@�@�@�@If sp < 0 And sq < 0 Then�@�@�@�@�@''If the vertex is in the 3rd quadrant �@�@�@�@�@�@�@�@�@�@Cells(3, "G") = 0�@�@�@�@�@'Write 0 in row 3 and column G �@�@�@�@�@�@�@�@�@�@Cells(4, "G") = 0�@�@�@�@�@'Write 0 in row 4 and column G �@�@�@�@�@�@�@�@�@�@For p = 0 To sp Step -0.05 �@�@�@�@�@�@�@�@�@�@�@�@�@Cells(3, "G") = p�@�@�@�@�@'Write the value of p in row 3 and column G �@�@�@�@�@�@�@�@�@�@�@�@�@Calculate�@�@�@�@�@'Recalculate �@�@�@�@�@�@�@�@�@�@Next p �@�@�@�@�@�@�@�@�@�@For q = 0 To sq Step -0.05 �@�@�@�@�@�@�@�@�@�@�@�@�@Cells(4, "G") = q�@�@�@�@�@'Write the value of q in row 4 and column G �@�@�@�@�@�@�@�@�@�@�@�@�@Calculate�@�@�@�@�@'Recalculate �@�@�@�@�@�@�@�@�@�@Next q �@�@�@�@�@�@�@End If �@�@�@End Sub �@�@�@��Consideration�� �@�@�@�@�@�@�@Let's run the macro and observe that the quadratic function y=a(x-p)^2+q is obtained by translating y=ax^2 by +p in the x-axis direction and +q in the y-axis direction. �@ |
| �@To table of contents�@ |
| �@�y1301�z Find prime numbers less than or equal to 20 using a macro.�@�@�@�@�@�@�@�@�@�@�@ |
�@�@�@��About prime number�� �@�@�@�@�@�@�@A prime number is a natural number greater than or equal to 2 that has no positive divisors other than 1 and itself. �@�@�@�@�@�@�@The following macro determines whether a number is prime by dividing it one by one until 2 or more and 1 smaller than itself and checking whether it is divisible. �@�@�@��About macro�� �@�@�@�@�@�@�@ �@�@�@Sub Sosu2() �@�@�@�@�@�@For n = 2 To 20 �@�@�@�@�@�@�@�@�@d = 0 �@�@�@�@�@'Initialize d �@�@�@�@�@�@�@�@�@For k = 2 To n - 1 �@�@�@�@�@�@�@�@�@�@�@�@If n Mod k = 0 Then �@�@�@�@�@'If k is a divisor of n �@�@�@�@�@�@�@�@�@�@�@�@�@�@�@d = d + 1�@�@�@�@�@ 'Add 1 to d. �@�@�@�@�@�@�@�@�@�@�@�@End If �@�@�@�@�@�@�@�@�@Next k �@�@�@�@�@�@�@�@�@If d = 0 Then �@�@�@�@�@'If d=0 �@�@�@�@�@�@�@�@�@�@�@�@MsgBox (n & "is prime�I") �@�@�@�@�@'Display the message that d is a prime number. �@�@�@�@�@�@�@�@�@End If �@�@�@�@�@�@Next n �@�@�@�@�@�@MsgBox ((n - 1) & " We have now completed our search for the following prime numbers.") �@'Display the "End" message. �@�@�@End Sub �@�@�@��Consideration�� �@�@�@�@�@�@�@Let's run the macro and find prime numbers less than or equal to 20. �@�@�@�@�@�@�@Next , let's rewrite the macro and find prime numbers less than or equal to 30. �@ |
| �@�y1302�z�@Find perfect numbers using a method other than brute force.�@ | ||||||||||||||||||||||||||||||||||||||||||||||||
| �@��Procedure�� �@�@�@(1) Create the following correspondence table on a worksheet.
�@�@�@�@�@�@�@�� Follow the steps below so that column D does not display "�����E-12". �@�@�@�@�@�@�@�@�@Select column D �� Right+click �� Format cells �� Display format �� Numerical value �� �n�j �@�@�@��About perfect number�� �@�@�@�@�@�@�@A perfect number is a natural number whose sum of positive divisors , excluding itself , is equal to itself. For example , the divisors of 6 , excluding itself , are 1,2,3 , so 1+2+3=6 , thefore , 6 is a perfect number. �@�@�@�@�@�@When n is a natural number greater than or equal to 2 and �@�@�@�@�@�@So , are all perfect numbers expressed as �@�@�@�@�@�@It has been proven that all even perfect numbers are denoted by �@�@�@�@�@�@However , the odd perfect number has not yet been discovered. It has not been proven that the odd perfect numbers don't exist. �@�@�@�@�@�@The following macro uses the fact that "When n is a natural number greater than or equal to 2 and �@�@�@��About macro�� �@�@�@Sub Kanzensusp() �@�@�@�@�@�@Dim n As Long �@�@�@�@�@'Declare as long integer type �@�@�@�@�@�@Dim k As Long �@�@�@�@�@'Declare as long integer type �@�@�@�@�@�@Dim d As Long �@�@�@�@�@'Declare as long integer type �@�@�@�@�@�@'Cells.Clear �@�@�@�@�@�@DoEvents �@�@�@�@�@'Make it possible to stop even in the middle of a ForLoop �@�@�@�@�@�@For n = 2 To 31 �@�@�@�@�@�@�@�@�@Cells(n, "A") = n �@�@�@'Assign the value of n to row n and column A �@�@�@�@�@�@�@�@�@Cells(n, "B") = 2 ^ n - 1�@�@�@ 'Assign the value of 2^n-1 to row n and column B. �@�@�@�@�@�@�@�@�@d = 0�@�@�@�@�@ 'initialize d. �@�@�@�@�@�@�@�@�@For k = 2 To 2 ^ n - 1 - 1 �@�@�@�@�@�@�@�@�@�@�@�@If (2 ^ n - 1) Mod k = 0 Then �@�@�@'If k is a divisor of 2^n-1 , then �@�@�@�@�@�@�@�@�@�@�@�@�@�@�@d = d + 1�@�@�@ 'Add 1 to d �@�@�@�@�@�@�@�@�@�@�@�@End If �@�@�@�@�@�@�@�@�@Next k �@�@�@�@�@�@�@�@�@If d = 0 Then �@�@�@�@�@'If d=0 then , then �@�@�@�@�@�@�@�@�@�@�@�@Cells(n, "C") = "Prime" �@�@�@'Assign "Prime number " to row n and column C. �@�@�@�@�@�@�@�@�@End If �@�@�@�@�@�@�@�@�@Cells(n, "D") = (2 ^ (n - 1)) * (2 ^ n - 1) 'Assign the value of 2^(n-1)*(2^n-1) to row n and column D �@�@�@�@�@�@�@�@�@If Cells(n, "C") = "Prime" Then �@�@�@�@�@'If row n and column C is "Prime number" , then �@�@�@�@�@�@�@�@�@�@�@�@Cells(n, "E") = "Perfect" �@�@�@�@�@'Assign "Perfect number" to row n and column E �@�@�@�@�@�@�@�@�@End If �@�@�@�@�@�@Next n �@�@�@�@�@�@MsgBox ("The search of perfect numbers has ended...") 'Display a completion message. �@�@�@End Sub �@�@�@��Consideration�� �@�@�@�@�@�@ Let's run the macro and find the perfect numbers. �@�@�@�@�@�@ It will take some time to find 8 perfect numbers. �@ |
| �@To table of contents�@ |
| �@�y1401�z�@Draw a figure (positive leaf curve) repesented by the polar equetion ��������������. | ||||||||||||||||||||||||||||||||||||||||||||||||||||||||||||||||||||||
| �@��Procedure�� �@�@�@(1) Create the following correspondence table on a warksheet.
�@�@�@��Reference�� �@�@�@�@�@�sHow to complete the worksheet above�t �@�@�@�@�@�@ Enter data in the cell range A2:A362 in 1 complements as shown in the the table above. �@�@�@�@�@�@ Enter ��SIN($F$2*RADIANS(A2)) in half-width in cell B2. �@�@�@�@�@�@ Copy cell B2 to the cell range B3:B362. �@�@�@�@�@�@ Enter ��B2*COS(RADIANS(A2)) in half-width in cell C21. �@�@�@�@�@�@ Copy cell C2 to cell range C3:D362. �@�@�@�@�@�@ Enter ��B2*SIN(RADIANS(A2)) in half-width in cell D2. �@�@�@�@�@�@ Copy cell D2 to the cell range D3:D362. �@�@�@�@�@�@ Enter "a=" in cell E2. �@�@�@�@�@�@ Enter "2" in cell F2. �@�@�@(2) Draw a graph from the correspondence table in (1) above. �@�@�@�@�@�@�@ Drag and select the cell range C2:D362 in the correspondence table of (1) above. �@�@�@�@�@�@�A Left-click �mIncert�n���mScatter plot�n���mScatter plot (smooth line)�n �@�@�@�@�@�@�B Delete the legend. �@�@�@(3) Arrange the xy coordinate plane on which the graph is drawn. �@�@�@�@�@�@�@ Set the scale interval of the x-axis to 0.1 between -1 and 1. �@�@�@�@�@�@�A Set the scale interval of the y-axis to 0.1 between -1 and 1. �@�@�@�@�@�@�B Set the scale line style to dotted lines for both the x-axis and y-axis. 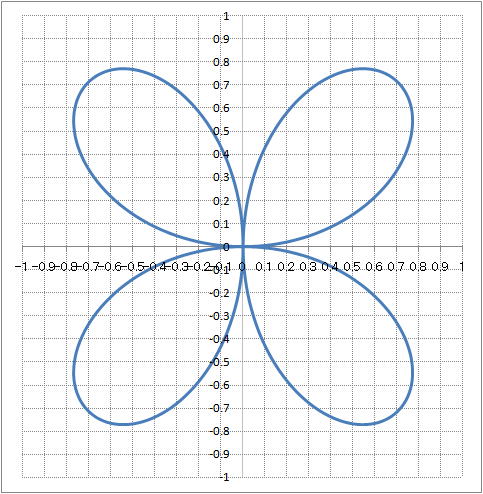 �@�@�@�@�@�@�@�q�`�c�h�`�m�r function ��� �q�`�c�h�`�m�r(Angle in degrees) �@�@�@�@�@�@�@�@�@�@Convert an angle in degrees to arc degrees. �@�@�@��About macro�� �@�@�@�@�@�@�@Sub Seiyou() �@�@�@�@�@�@�@�@�@�@Dim a As Single�@�@�@'Declare a as a single-precision floating point type. �@�@�@�@�@�@�@�@�@�@For a = 0 To 10.05 Step 0.05 �@�@�@�@�@�@�@�@�@�@�@�@�@Cells(2, "F") = a�@�@�@'Assign the value of a to row 2 and column F. �@�@�@�@�@�@�@�@�@�@�@�@�@Calculate�@�@�@'Recalculate �@�@�@�@�@�@�@�@�@�@Next a �@�@�@�@�@�@�@End Sub �@�@�@��Consideration�� �@�@�@�@�@�@�@Let's sequentially substitute 2 , 3 , 4 , ���,10 into cell F2 (value of a) and observe the drawn figure (positive leaf curve). �@�@�@�@�@�@�@Also , let's run the macro and observe the figures drawn as the value of a changes from 0 to 10 in 0.05 increments. �@ |
| �@�y1402�z�@Draw the figure (Archimedes spiral line) represented by the polar equation r=a��. | ||||||||||||||||||||||||||||||||||||||||||||||||||||||||||||||||||||||
| �@��Procedure�� �@�@�@(1) Create the following correspondence table on a worksheet.
�@�@�@��Reference�� �@�@�@�@�@�sHow to complete the worksheet above�t �@�@�@�@�@�@�@Enter data in the cell range A2:A722 in increments of 1 as shown in the table above. �@�@�@�@�@�@�@Enter ��$F$2*RADIANS(A2) in half-width in cell B2. �@�@�@�@�@�@�@Copy cell B2 to the cell range B3:B722. �@�@�@�@�@�@ Enter ��B2*COS(RADIANS(A2)) in half-width in cell C2. �@�@�@�@�@�@�@Copy cell C2 to the cell range C3:C722. �@�@�@�@�@�@ Enter ��B2*SIN(RADIANS(A2)) in half-width in cell D2. �@�@�@�@�@�@�@Copy cell D2 to the cell range D3:D722. �@�@�@�@�@�@�@Enter "a=" in cell E2. �@�@�@�@�@�@�@Enter "2" in cell F2. �@�@�@(2) Draw a graph from the correspondence table in (1) above. �@�@�@�@�@�@�@ Drag and select the cell range C2:D722 in the correspondence table of (1) above. �@�@�@�@�@�@�A Left-click �mIncert�n���mScatter plot�n���mScatter plot�iSmooth line�j�n �@�@�@�@�@�@�B Delete legend. �@�@�@(3) Arrange the xy-coordinate plane on which the graph is drawn. �@�@�@�@�@�@�@ Set the x-axis scale to -150 or more and 150 or less , and set the scale interval to 30. �@�@�@�@�@�@�A Set the y-axis scale to -150 or more and 150 or less , and set the scale interval to 30. �@�@�@�@�@�@�B Set the scale line style to the dotted lines for both the x-axis and y-axis. 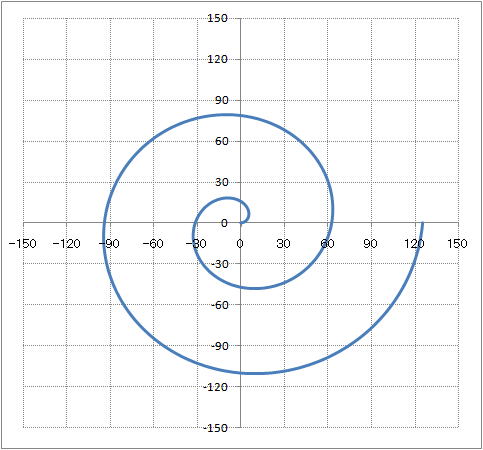 �@�@�@��About functions�� �@�@�@�@�@�@�@�q�`�c�h�`�m�r function��� �q�`�c�h�`�m�r(Angle in degrees) �@�@�@�@�@�@�@�@�@�@Convert angles in degrees to arc degrees. �@�@�@��About macro�� �@�@�@�@�@�@�@Sub Aruki() �@�@�@�@�@�@�@�@�@�@Dim a As Single�@�@�@'Declare a as a singe-precision floating point type �@�@�@�@�@�@�@�@�@�@For a = 0 To 10.05 Step 0.05 �@�@�@�@�@�@�@�@�@�@�@�@�@Cells(2, "F") = a�@�@�@'Assign the value of a to row 2 and column F. �@�@�@�@�@�@�@�@�@�@�@�@�@Calculate�@�@�@'Recalculate �@�@�@�@�@�@�@�@�@�@Next a �@�@�@�@�@�@�@End Sub �@�@�@��Consideration�� �@�@�@�@�@�@�@Let's sequentially assign 2 , 3 , 4 , ���, 10 to cell F2 (value of a) and obseve the drawn figure (Archmedean spiral line). �@�@�@�@�@�@�@Also , let's run the macro and observe the figures drawn as the value of a changes from 0 to 10 in 0.05 increments. �@ |
| ���@You can download the above sample data files "�`.xls" below. |
| �@To table contents�@ |
| �@When you downloaded the data below for how to use Excel , compressed file
"sample_excel.lzh" will be downloaded. �@When the downloaded compressed file "sample_excel.lzh" is decompressed , a folder "Sample data for thinking about how to use "Excel" is created. �@When you download the sample data for "simulation" , "Prime and Perfect Numbers" , and "Polar Equation"below , copmressed file "ExcelSample2.lzh" will be downloaded. �@When the downloaded compressed file "ExcelSample2.lzh" is downloaded , the sample data "Simulation" , "Prime and Perfect Number" , and "Polor Equation" are created. |
| �@�d�������� sample data | �@Sample data for thinking about how to use "Excel" |
| �@�d�������� sample data 2�@ | �@"Simulation" , "Prime and Perfect Number" , "Polar Equation "sample data |
| �@To table of contents�@ |
| �@There are 11 folders "[0100]Quadratic function" , "[0200]Trigonometric function" , "[0300]Exponential function" , "[0400]Logarithmic function" , "[0500]Various curves" , "[0600]Differentiation(Part 1)" , "[0700]Differentiation (Part 2)" , "[0800]Integral" , "[0900]Number sequence" , "[1000]Complex number" , "[1100]Application of square roots" in the folder "Sample data for thinking about how to use Excel". Open the files "�`.xlsm" in each folder in Excel. |
| �@There are six files in the folder "Simulation " , "Prime and Perfect Numbers" , "Polor Equations" sample data. Open each file "�`.xlsm" in Excel. |